Free + Pro
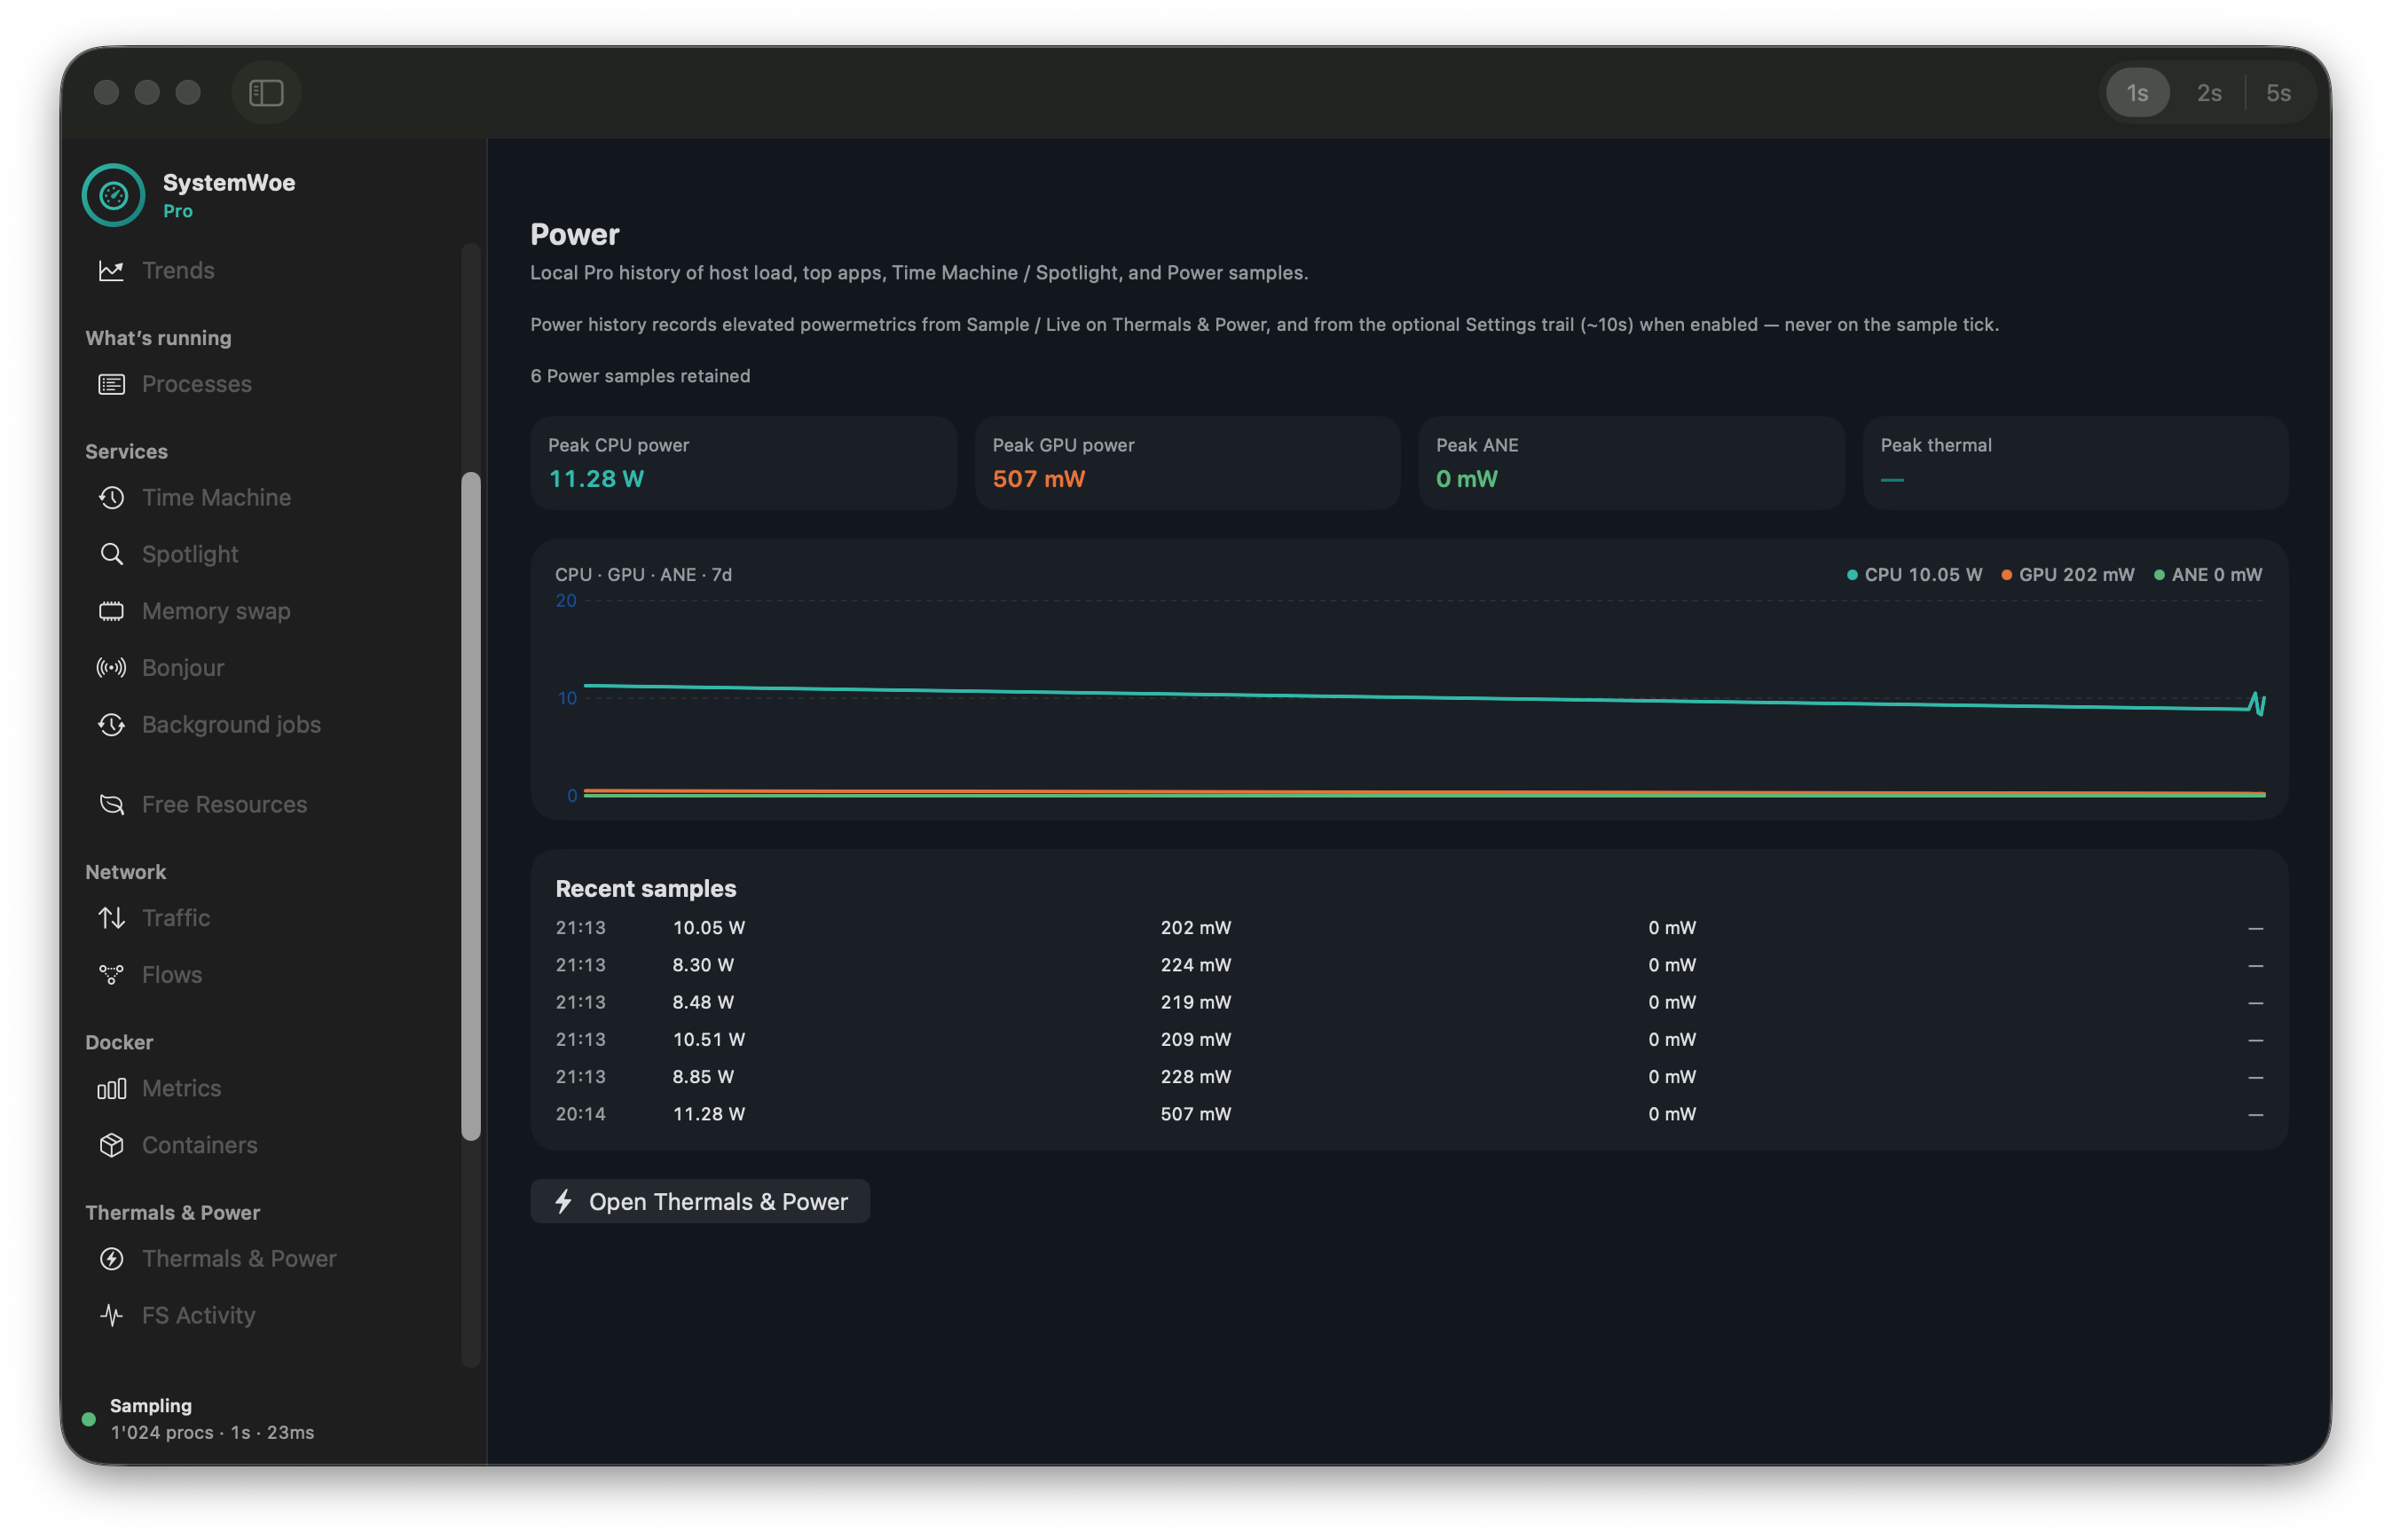
Lives in the menu bar
SystemWoe starts as a quiet menu-bar utility — open the window when you need depth, not as another Dock clutter app.
- Launch intro points at the menu-bar gauge so you don’t miss where it lives
- Opens at login if you want it — Settings toggle for Free and Pro
- Main window shows in the Dock only while you use it, then returns to accessory
Free + Pro
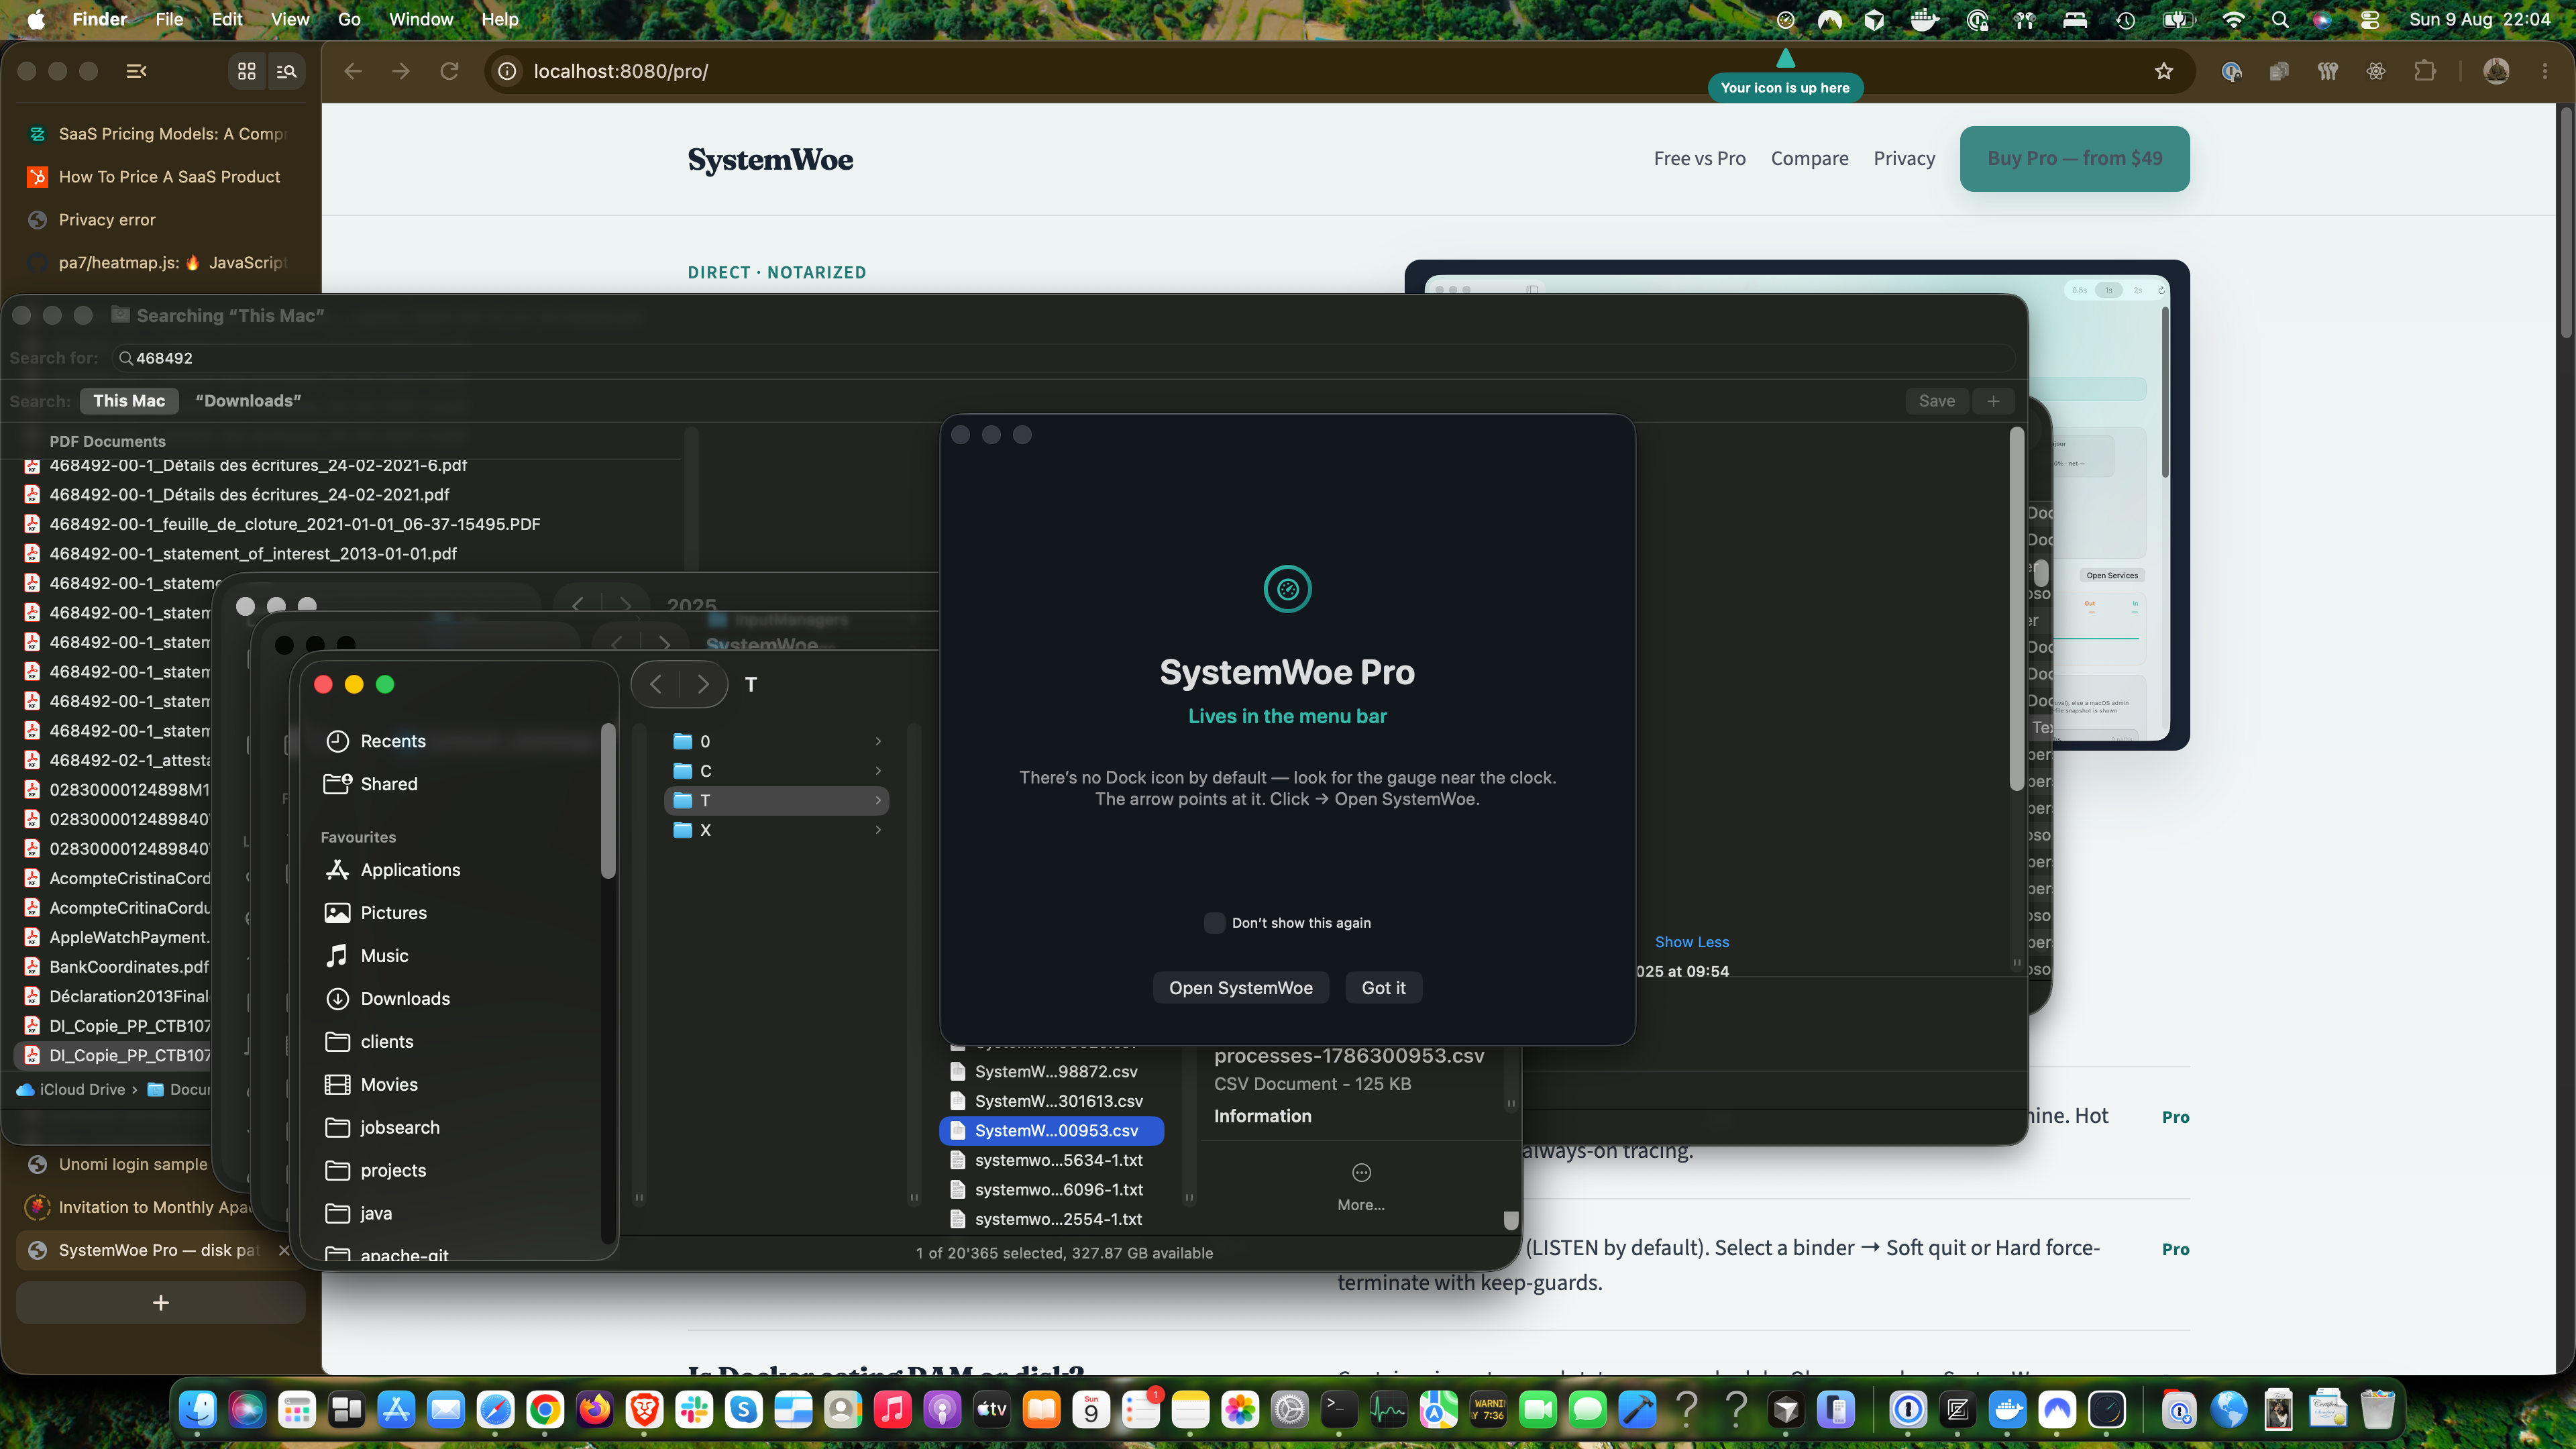
Live meters without opening the window
Glance at CPU, memory, and disk pressure — including swap when it matters — from a compact agent panel.
- Mini rings plus ranked top processes for the metric that hurts
- Up to three Disk Now cause chips when Spotlight, Time Machine, or swap is loud
- Open SystemWoe for the full situation view in one click
Free + Pro
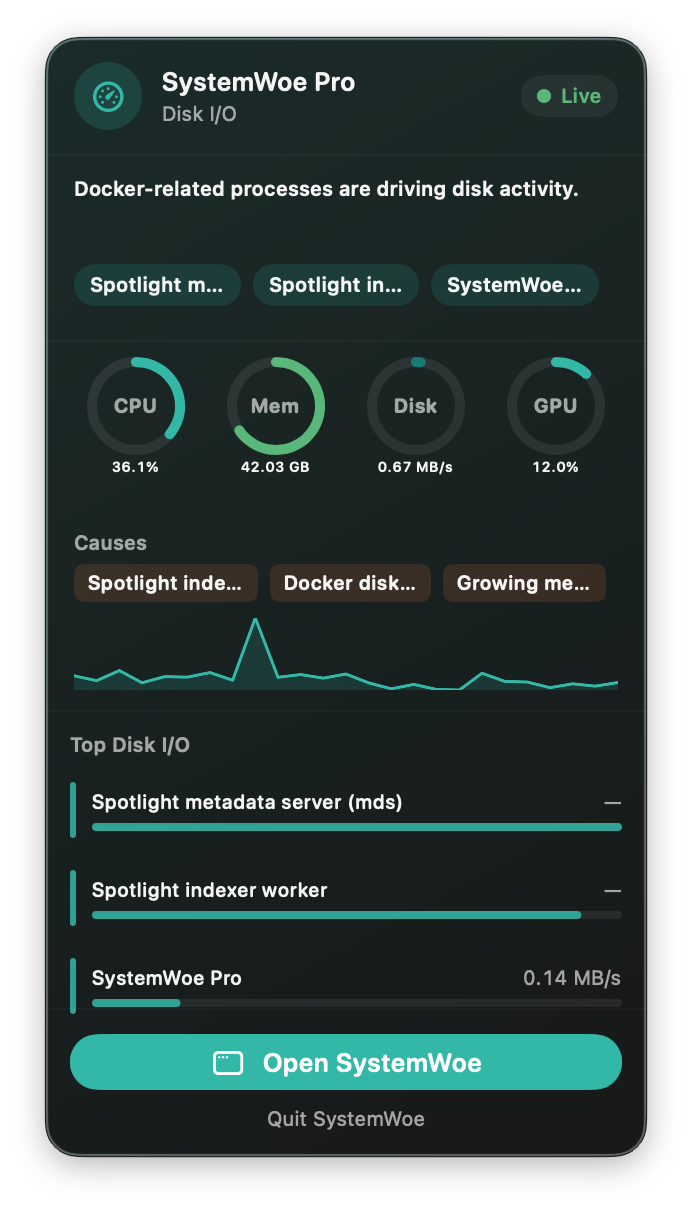
Situation-first Overview
A plain-language diagnosis of what’s going on, with named culprits — not just a wall of charts.
- One-line situation teaser plus full rings, diagnostics, and charts
- Deep-links into Disk, What’s running, Network, and Services when a chip fires
- Power users keep every meter; mass users get the sentence first
Free + Pro
What’s running — explained
Sort by CPU, memory, disk, or network, then read a trustworthy encyclopedia card for the mystery process.
- Knowledge titles and Doing / Safety columns by default
- Inspector with summary, quit hint, open-files snapshot, and suggest-an-edit
- Same catalog as the web encyclopedia — Free syncs packs; Pro adds identity depth on demand
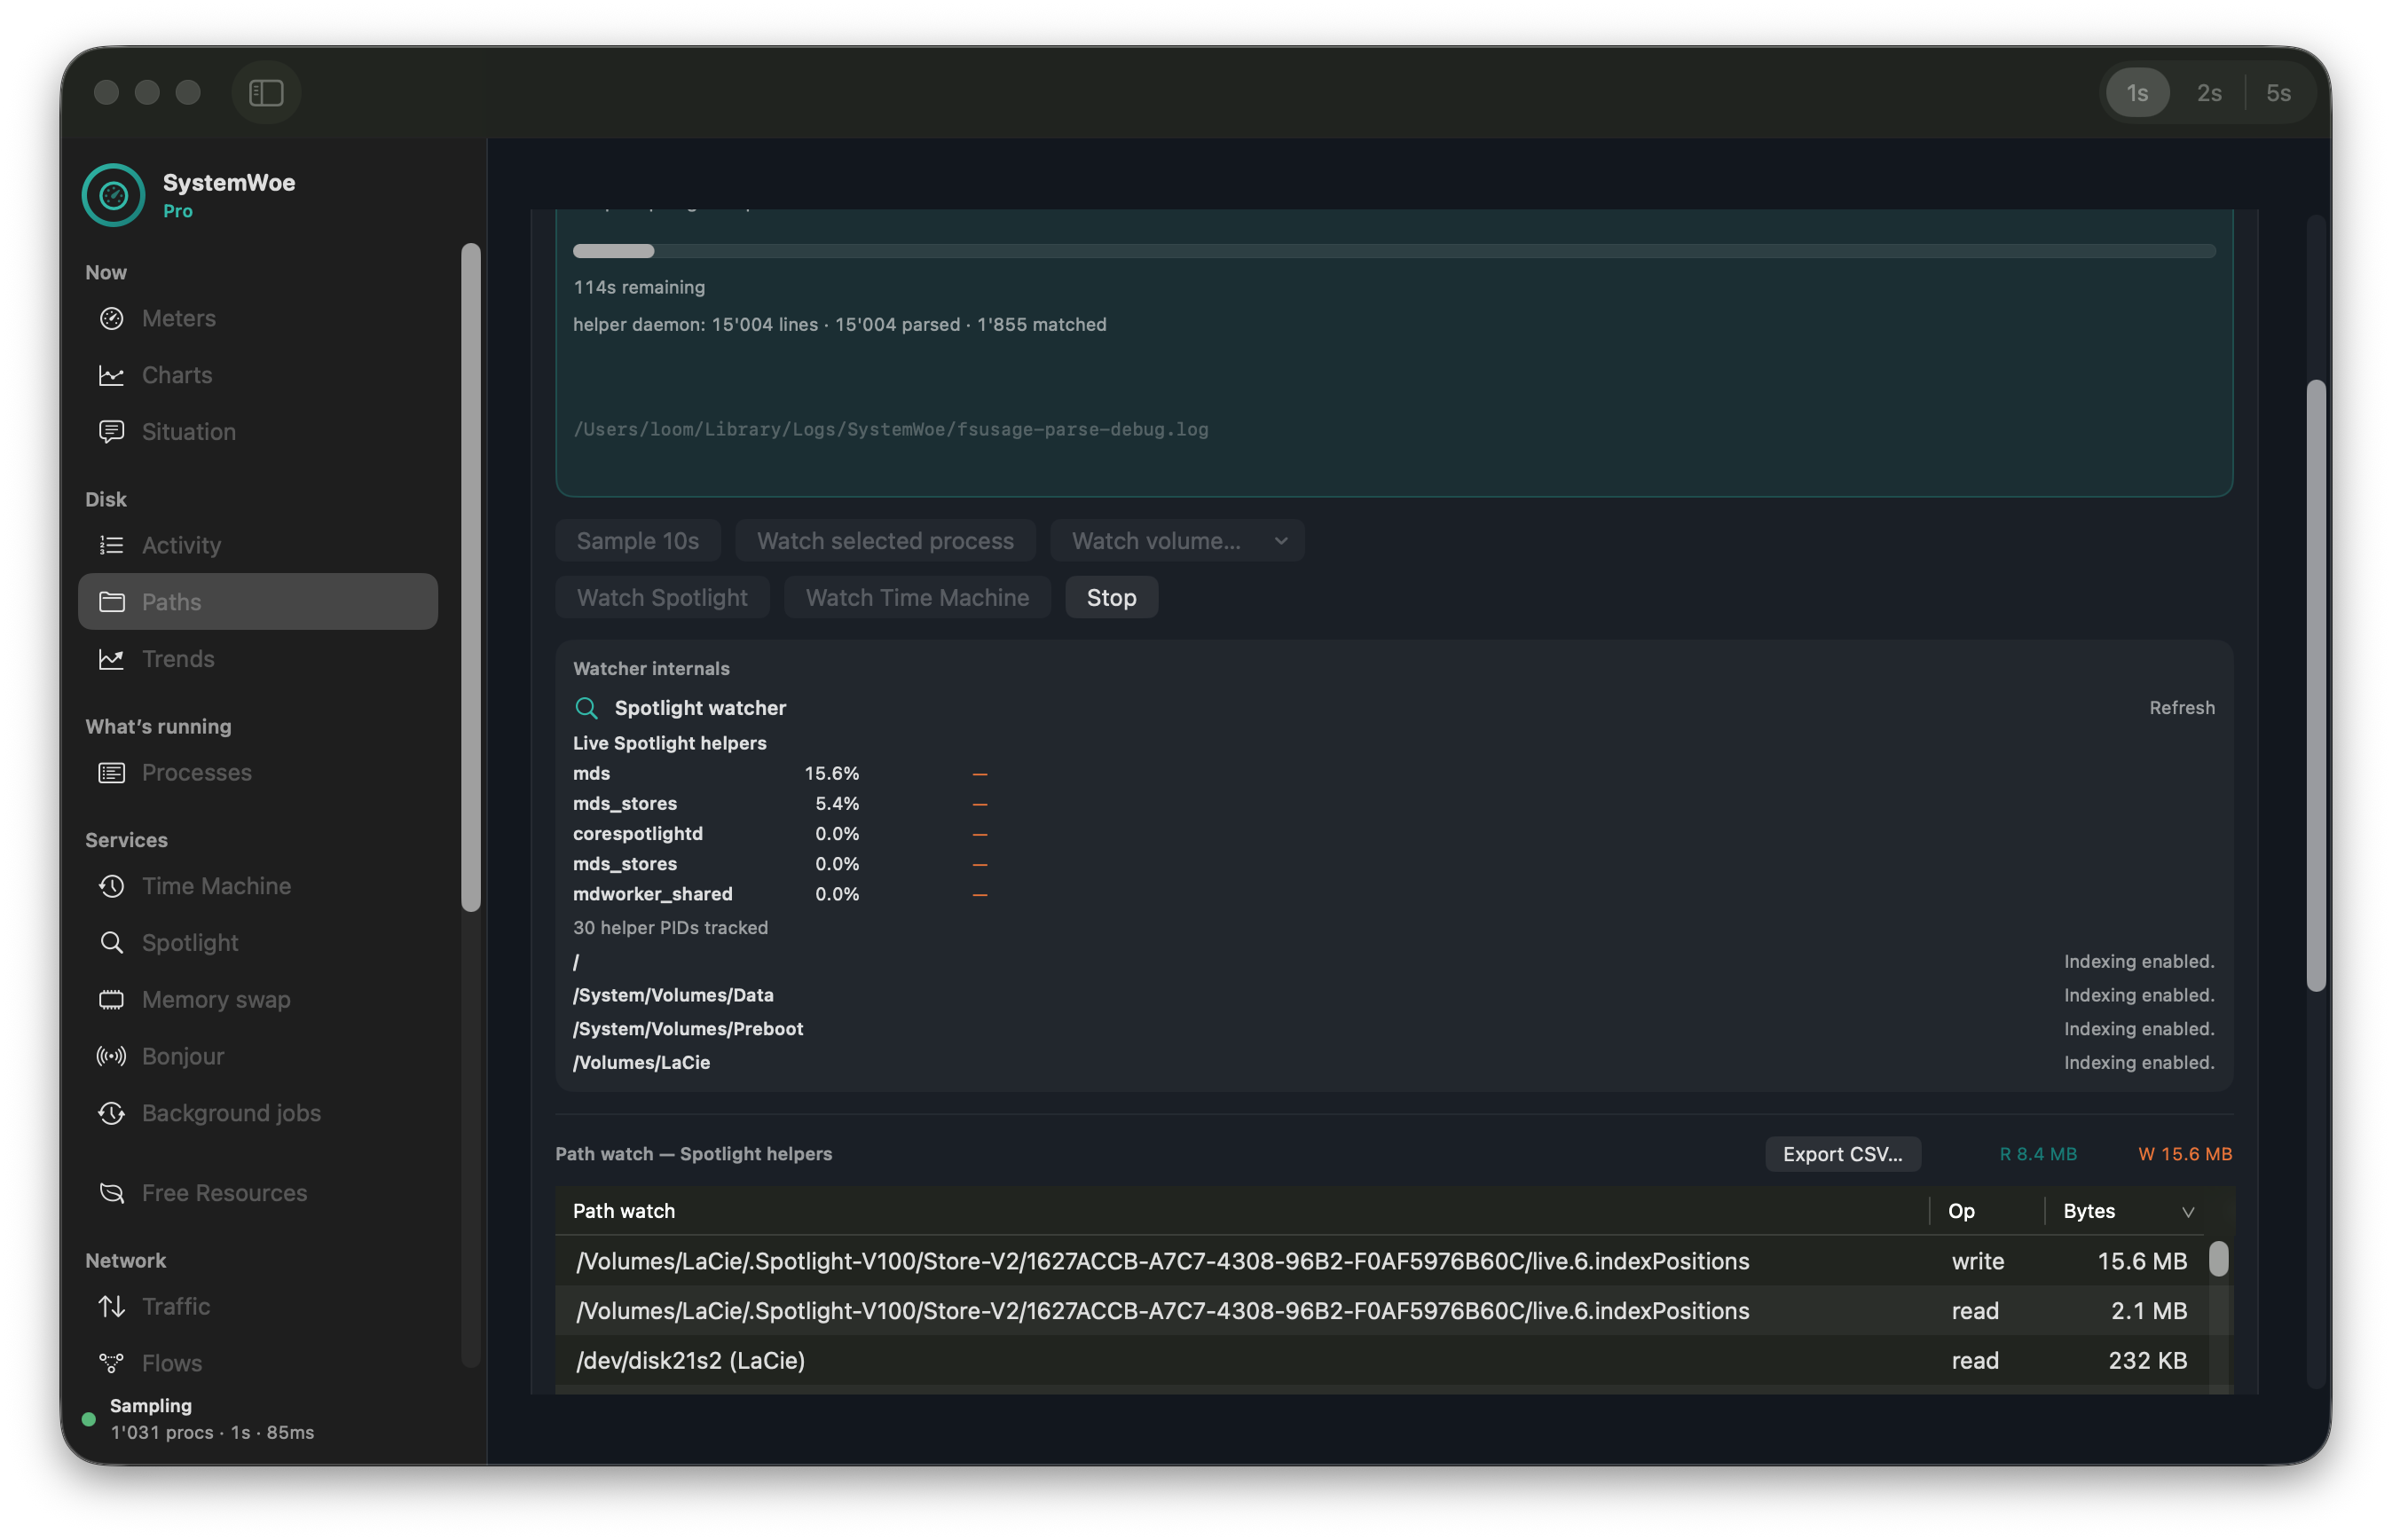
Free · paths in Pro
Disk Now — writers, swap, and hot paths
See host disk and swap together, with cause chips for Spotlight, Time Machine, Bonjour, and more.
- Top writers ranked so you know who is chewing the disk
- Pro path Sample (10s) or Watch scoped to a process, volume, Spotlight, or Time Machine
- Honest about buffer-cache estimates — rankings are guidance, not forensic truth
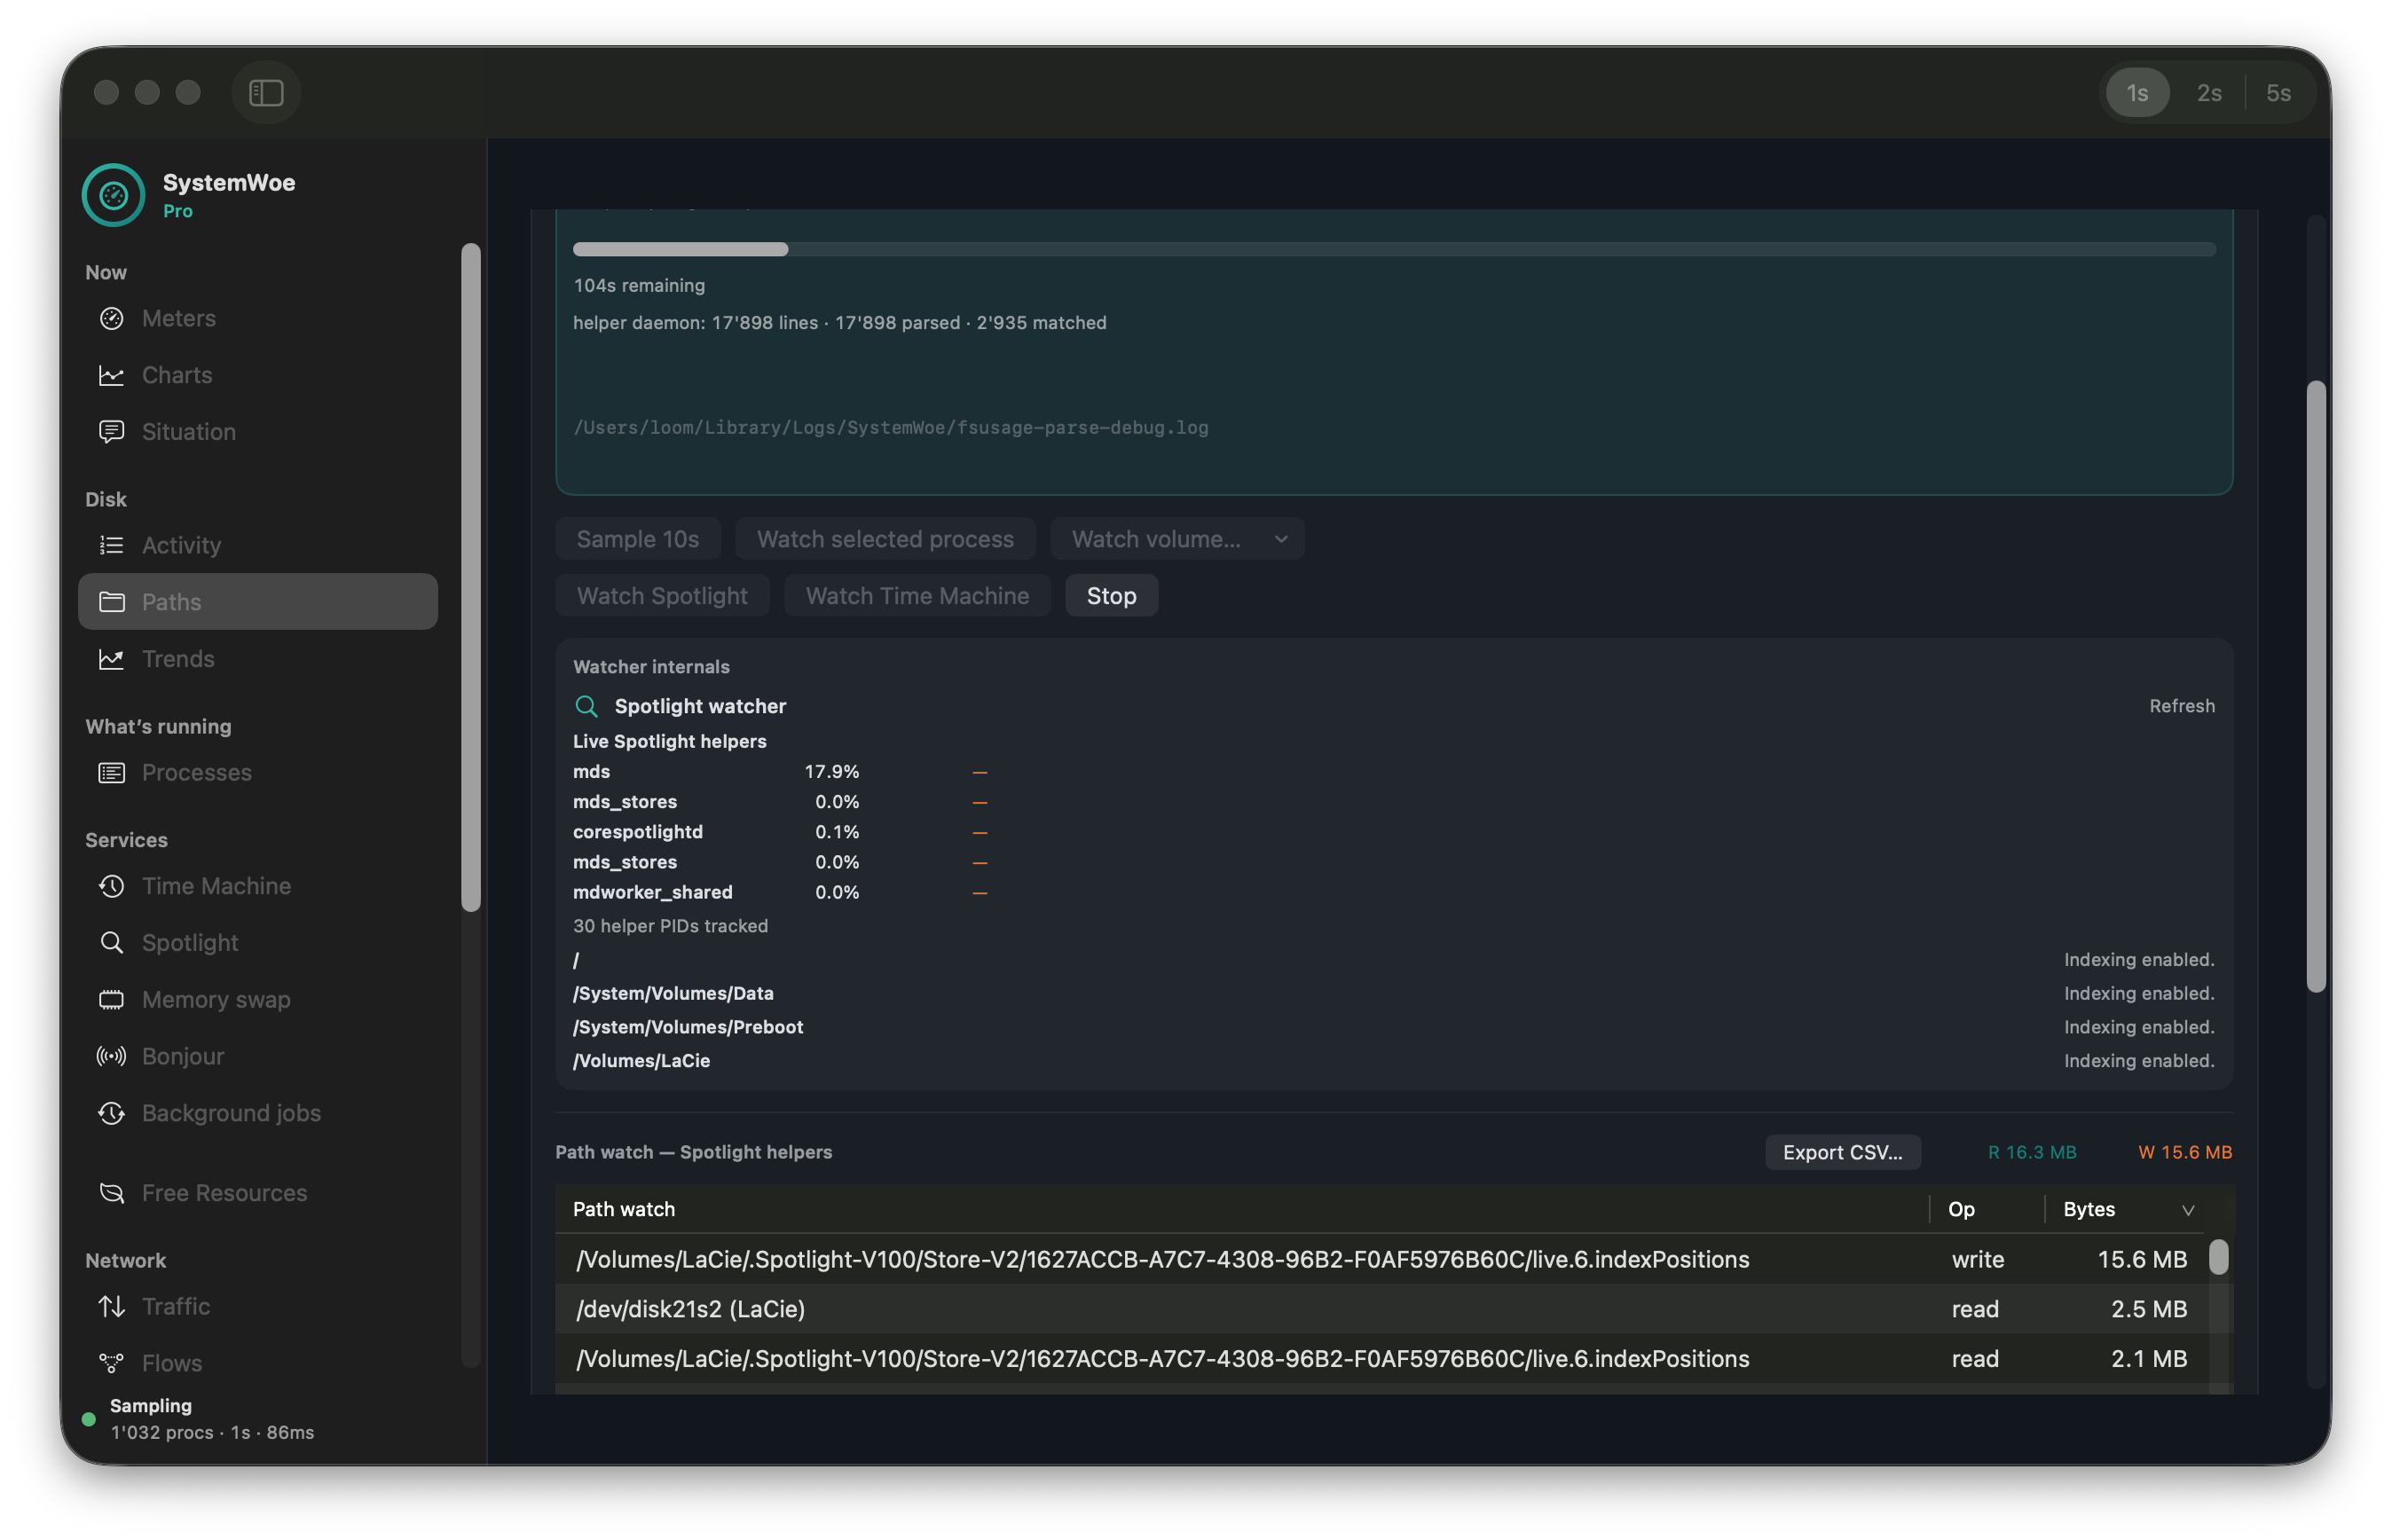
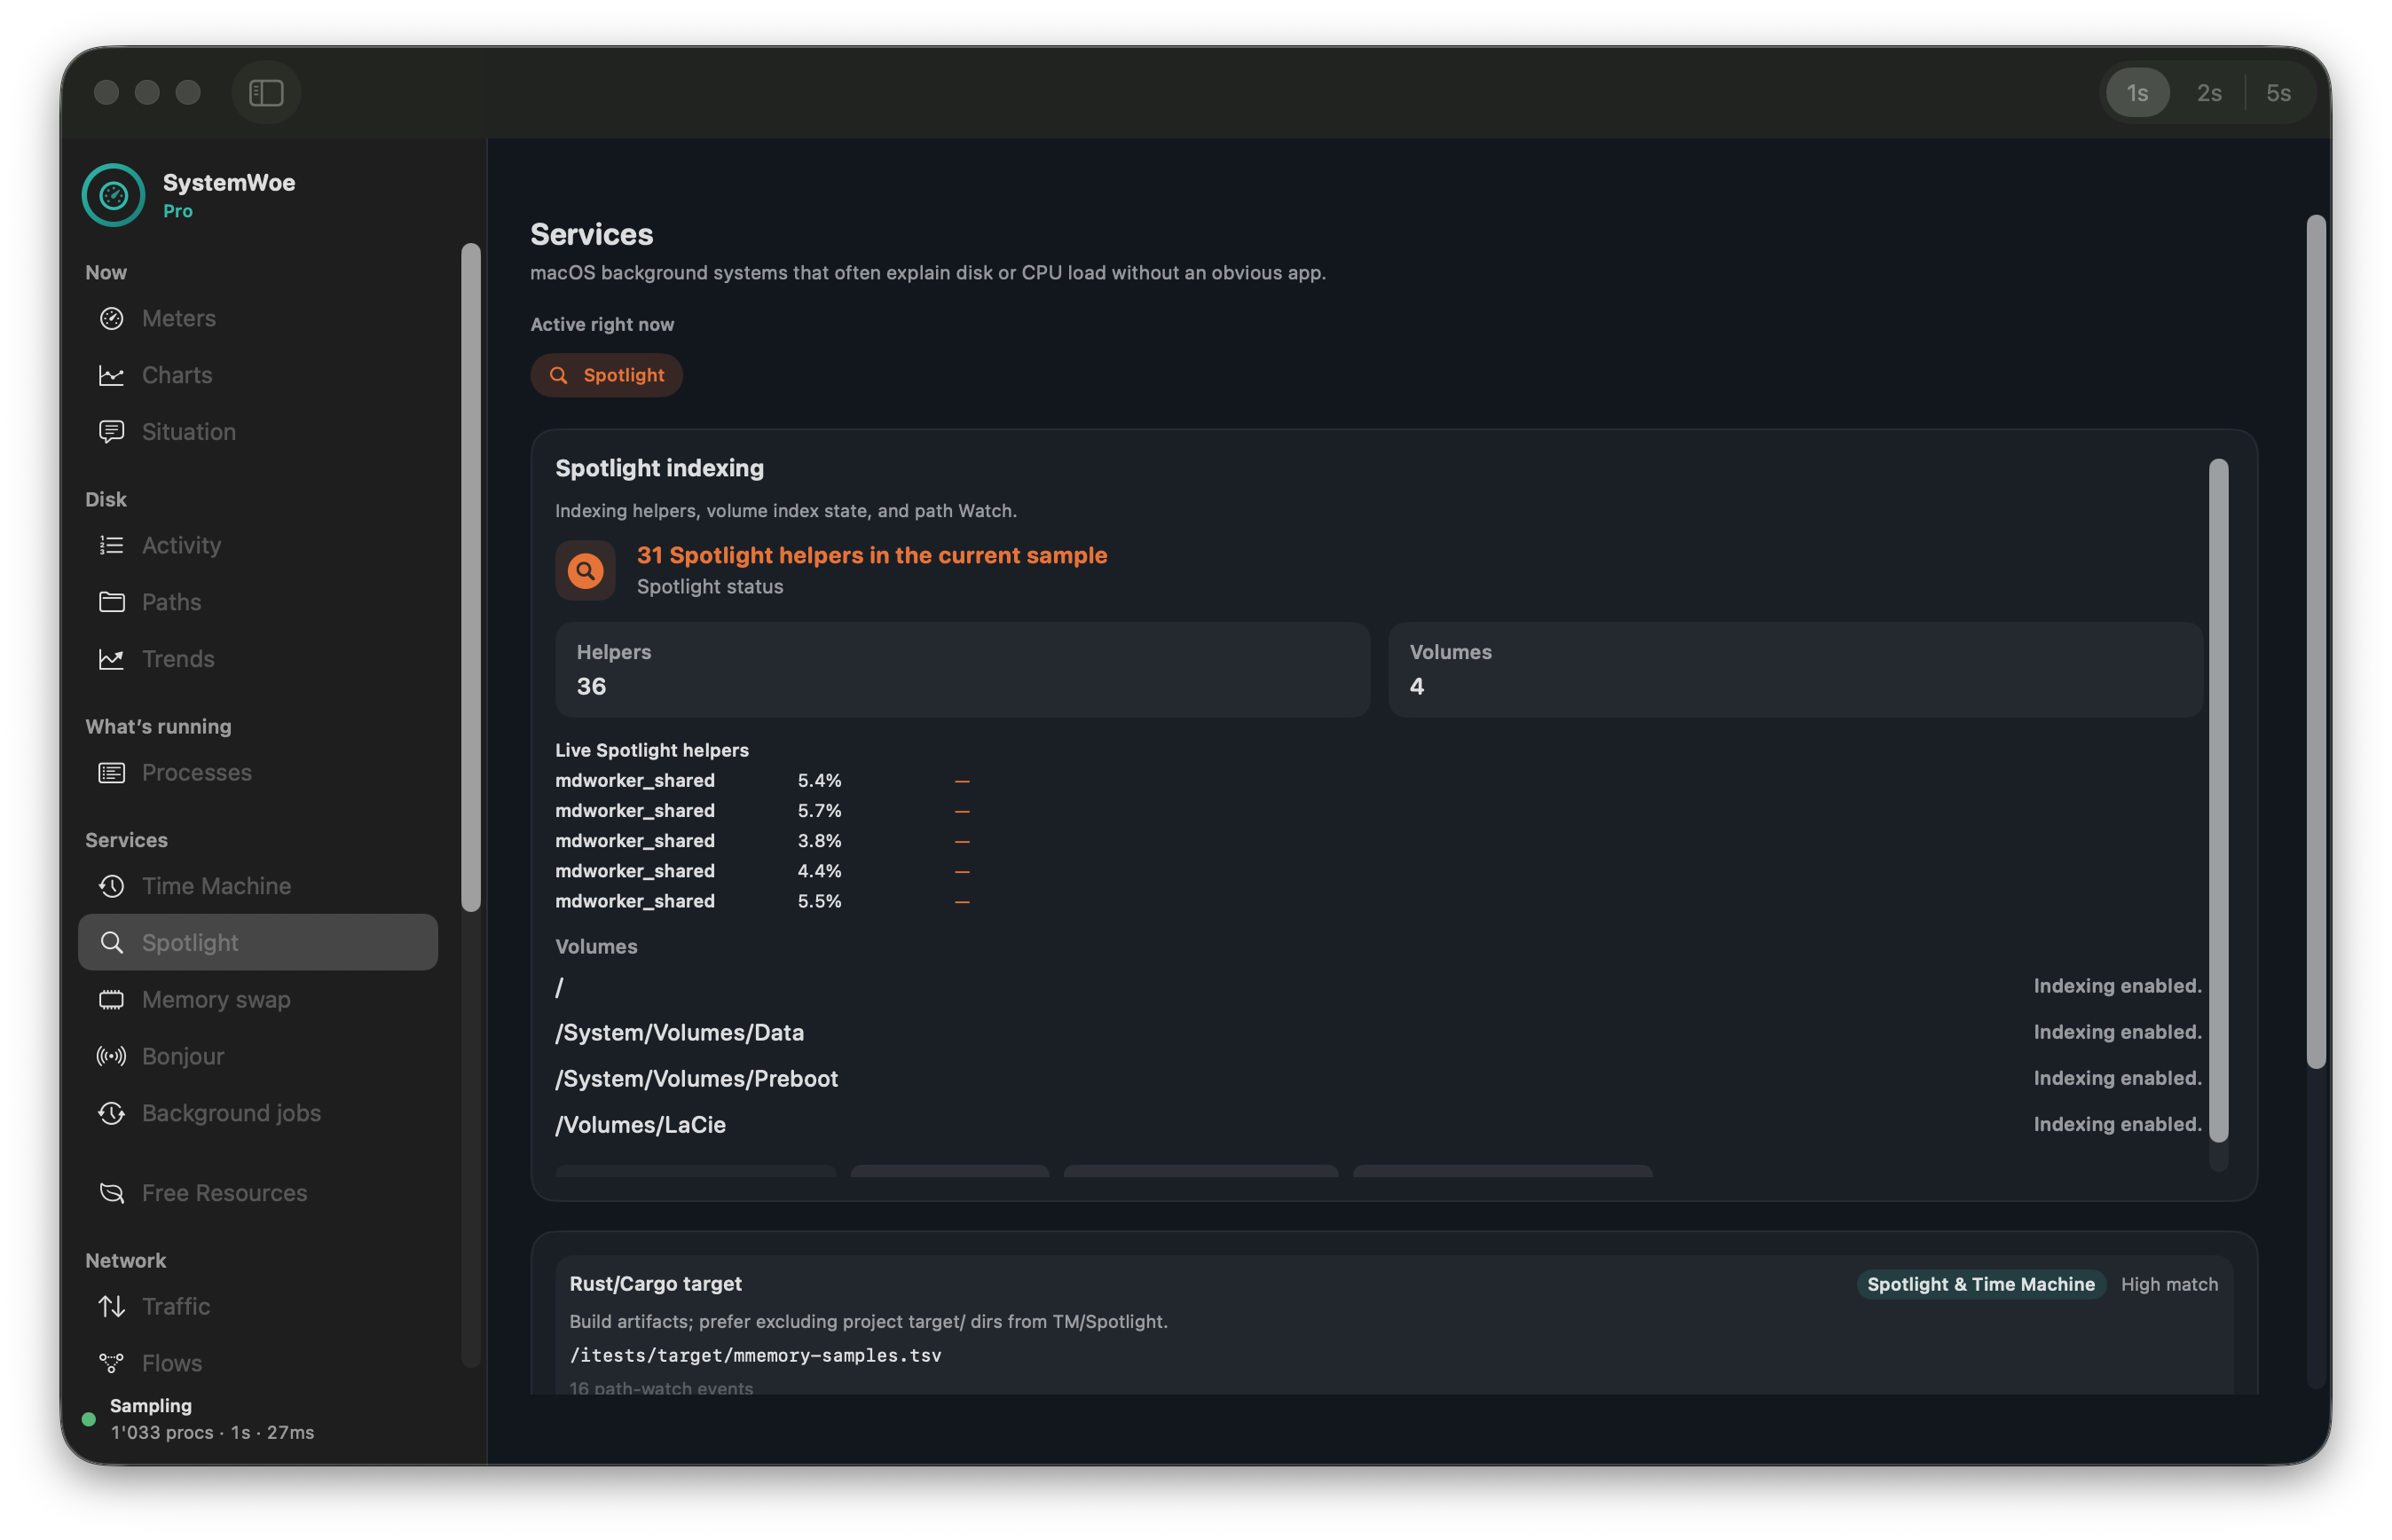
Free explain · Pro live
Spotlight, Time Machine, and swap — named
Services turns noisy subsystems into a narrative: is indexing hot, is backup really idle, is memory pressure swap?
- Free explains helpers; Pro adds live tmutil / mdutil panels and local snapshots
- Catches “disk busy but Time Machine looks idle” on a backup volume
- Exclude tips for node_modules / DerivedData — copy recipes only, never silent writes
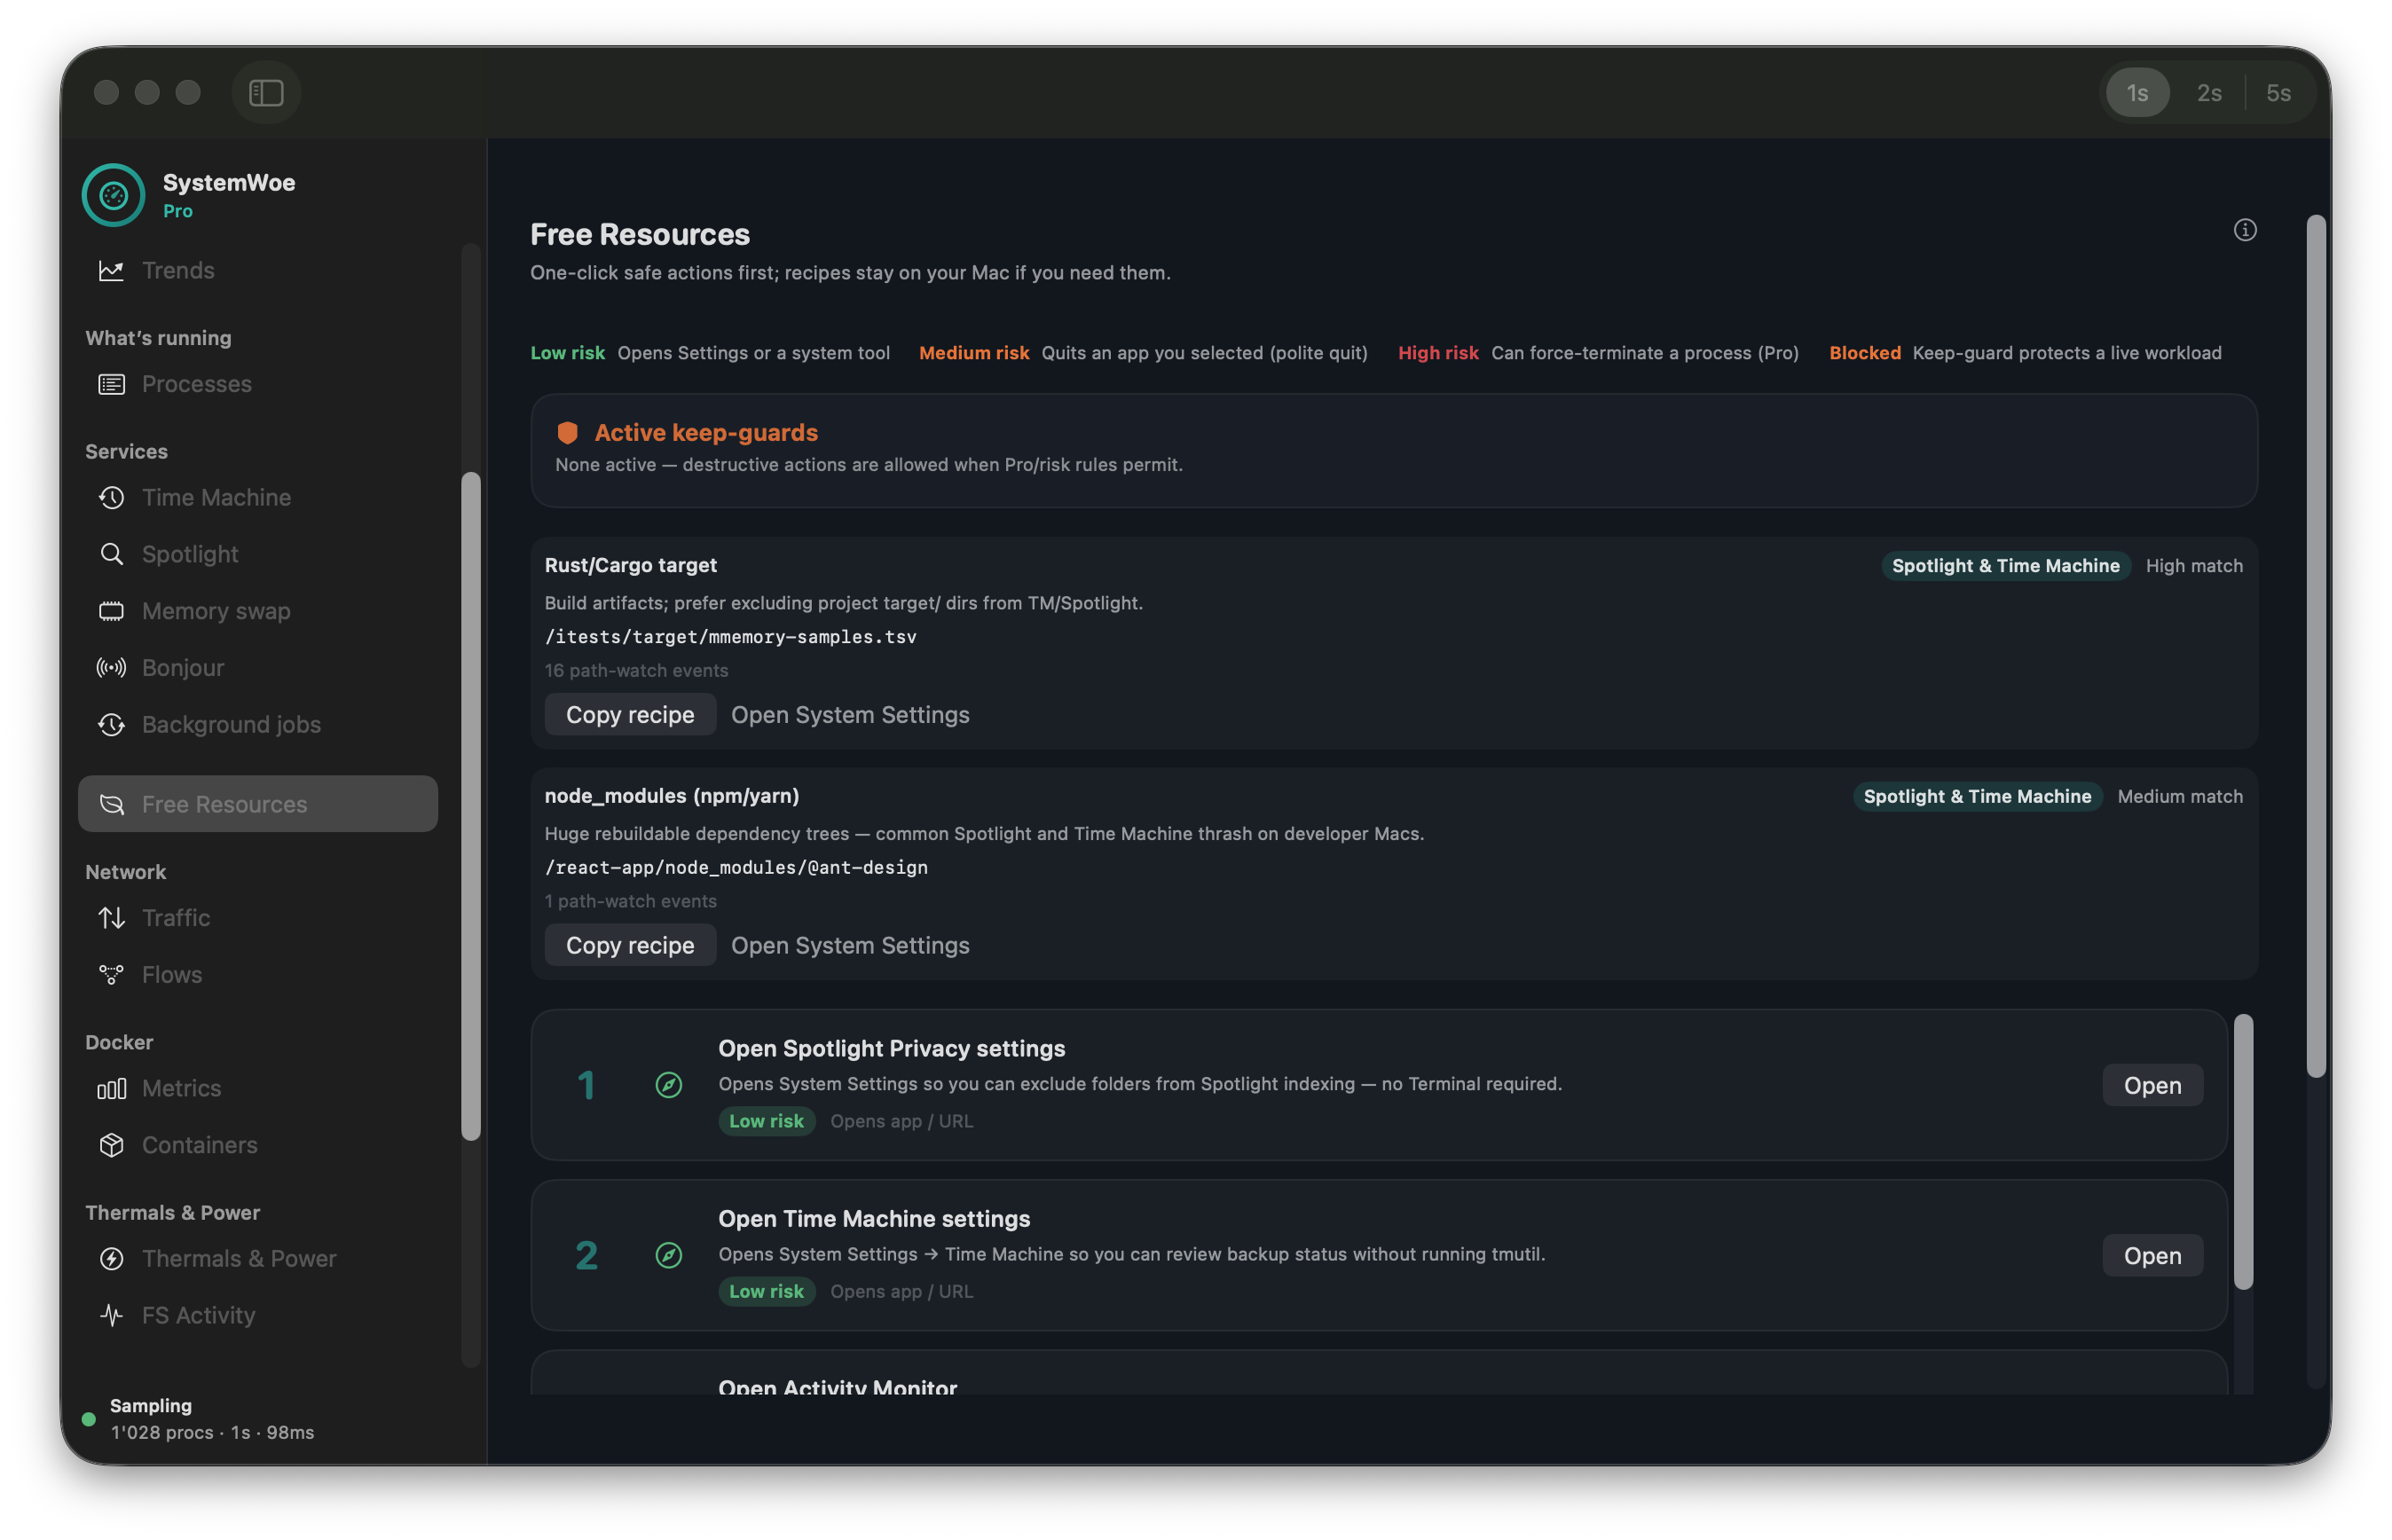
Free + Pro
Free Resources — safely
Ranked actions with keep-guards so you quit what’s yours without killing protected workloads.
- Open Settings / Activity Monitor, quit your own apps, copy recipes
- Pro adds force-terminate and Docker stop with confirmation
- Never silent cleanup, never quit Docker Desktop
Go deeper with Pro
Pro
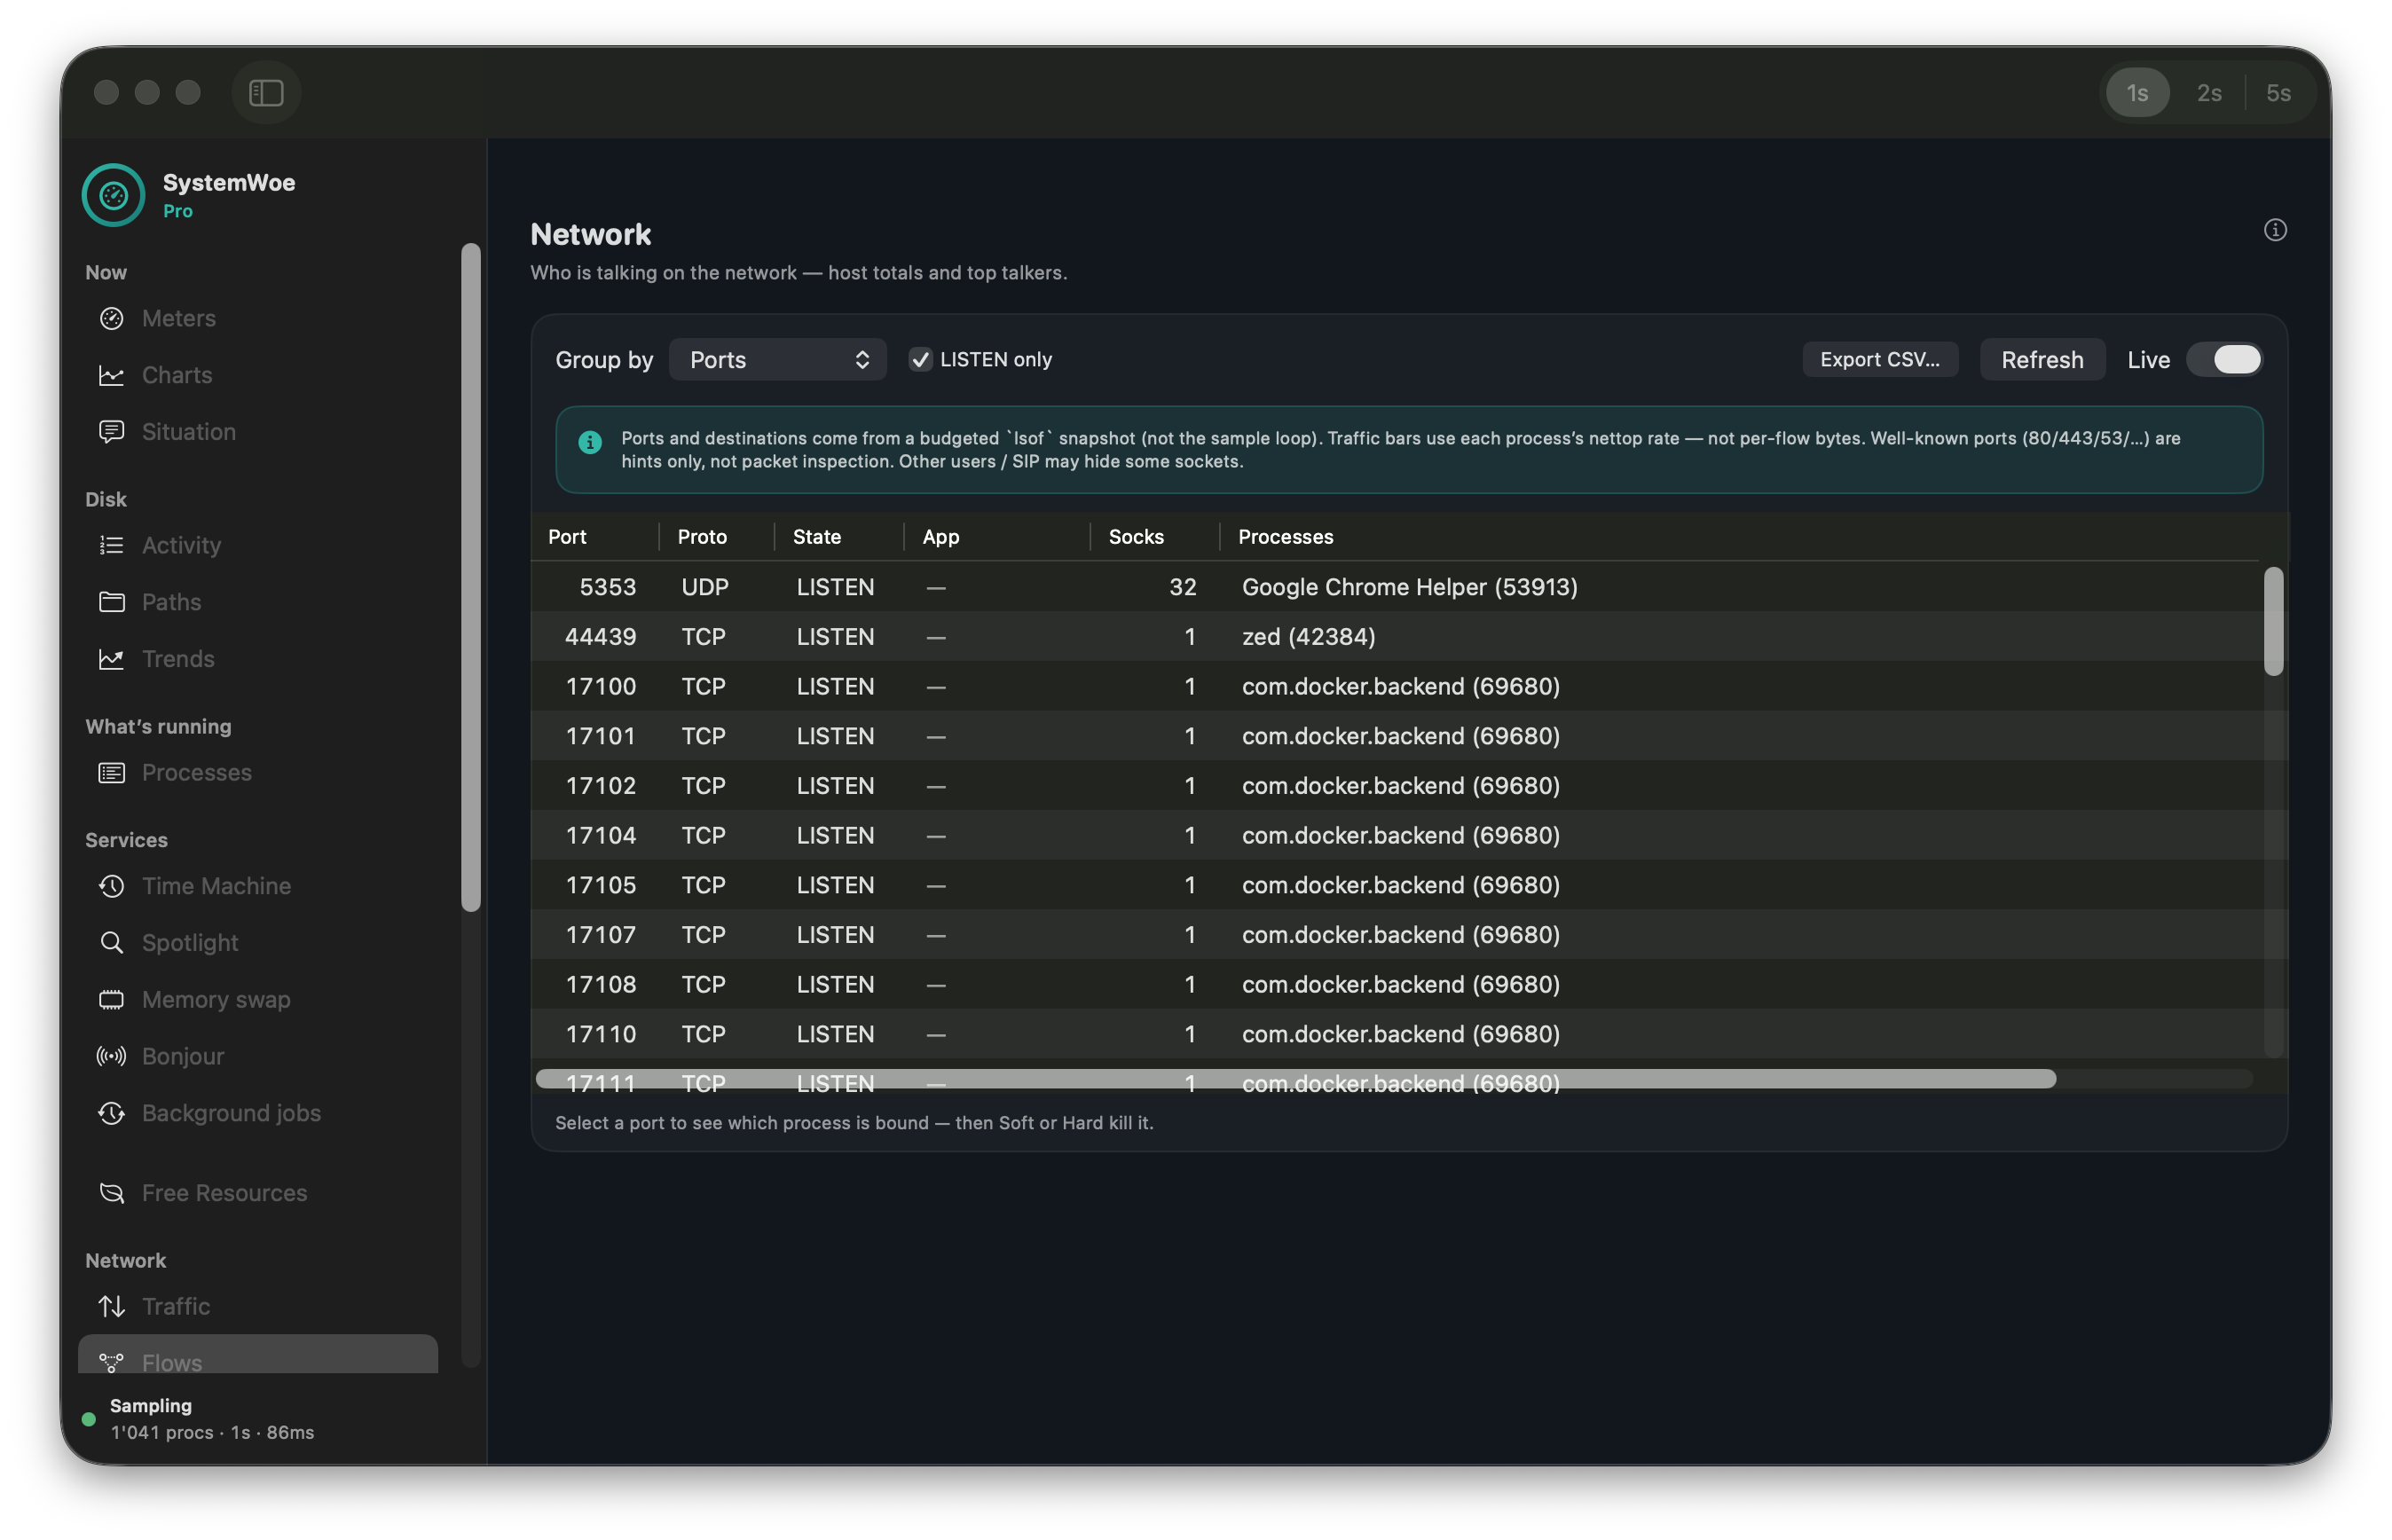
Ports → process, destinations → host
Network Flows answers what is listening and where traffic is going — without a mystery lsof hunt.
- Budgeted port scan; select a binder for Soft quit or Hard force-terminate
- Destinations fill hostnames and LAN/WAN/ASN facts from a local cache
- Talkers ranked by live rates; Docker published ports map when stats are on
Pro
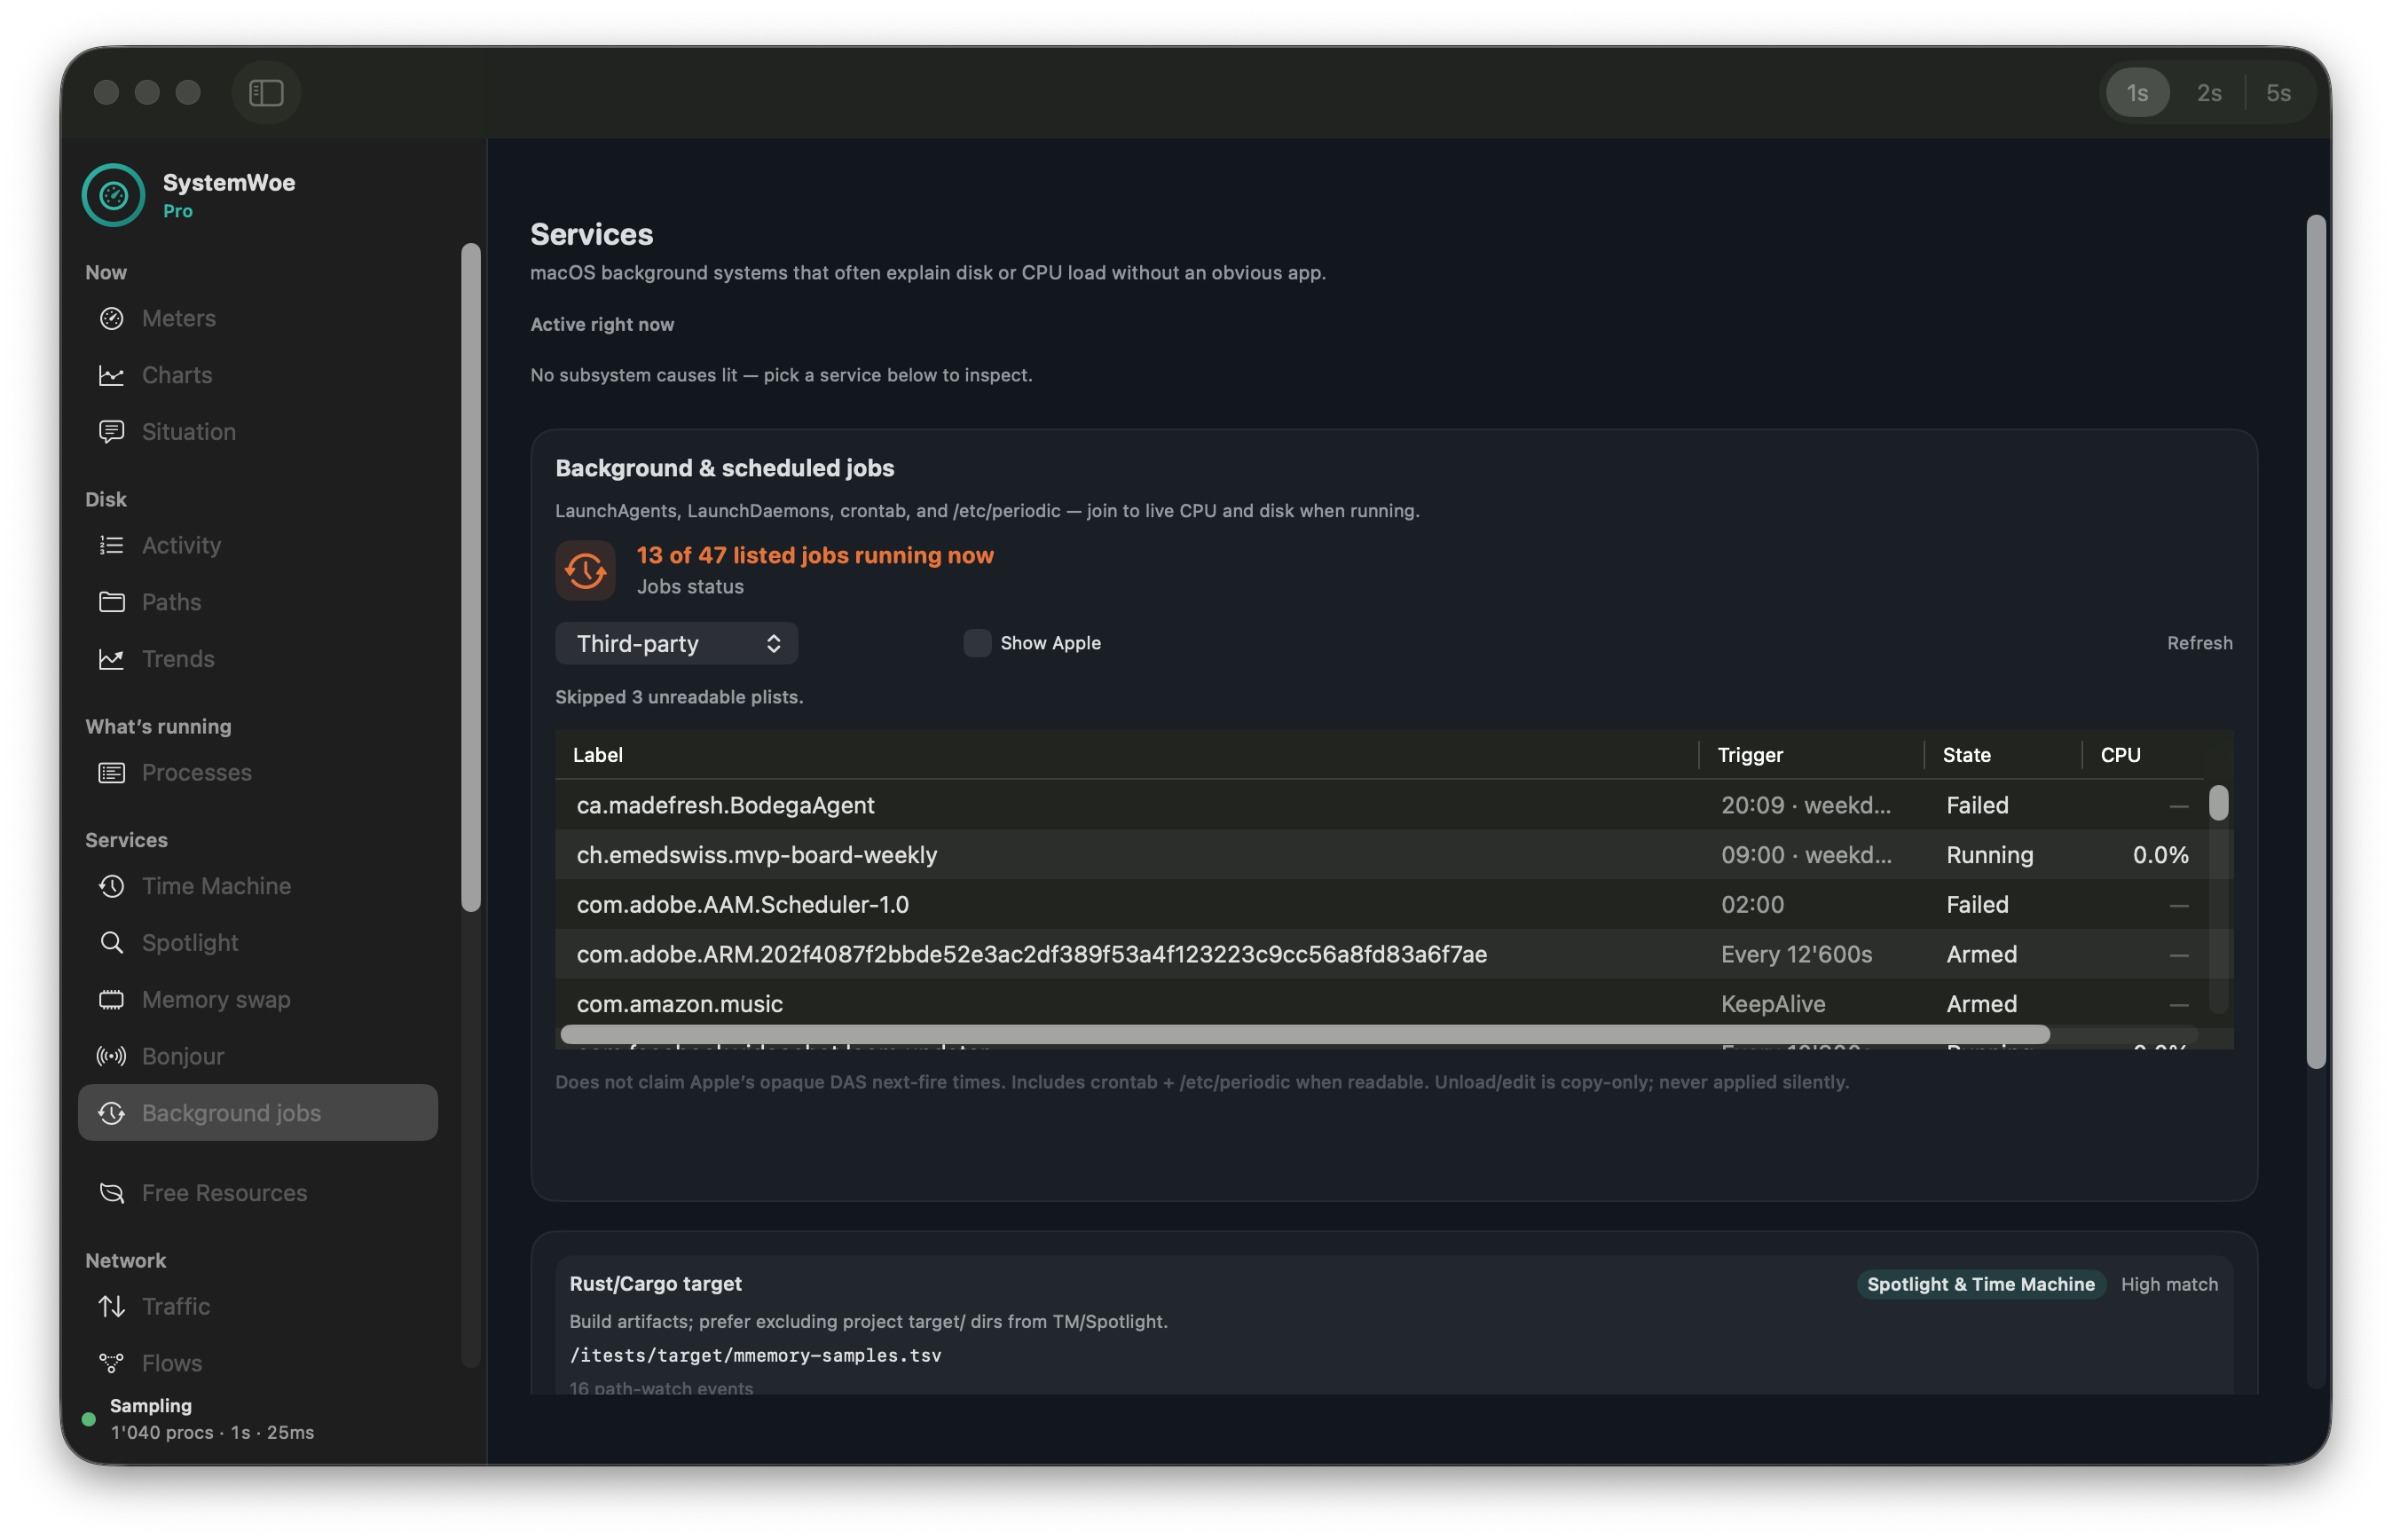
Background jobs without LaunchControl theater
LaunchAgents, Daemons, and cron / periodic joined to live CPU and disk — see what’s waking up.
- Inventory while Services → Jobs is open
- Copy unload recipes; never silent unload
- launchctl print on select when you need the full dump
Pro
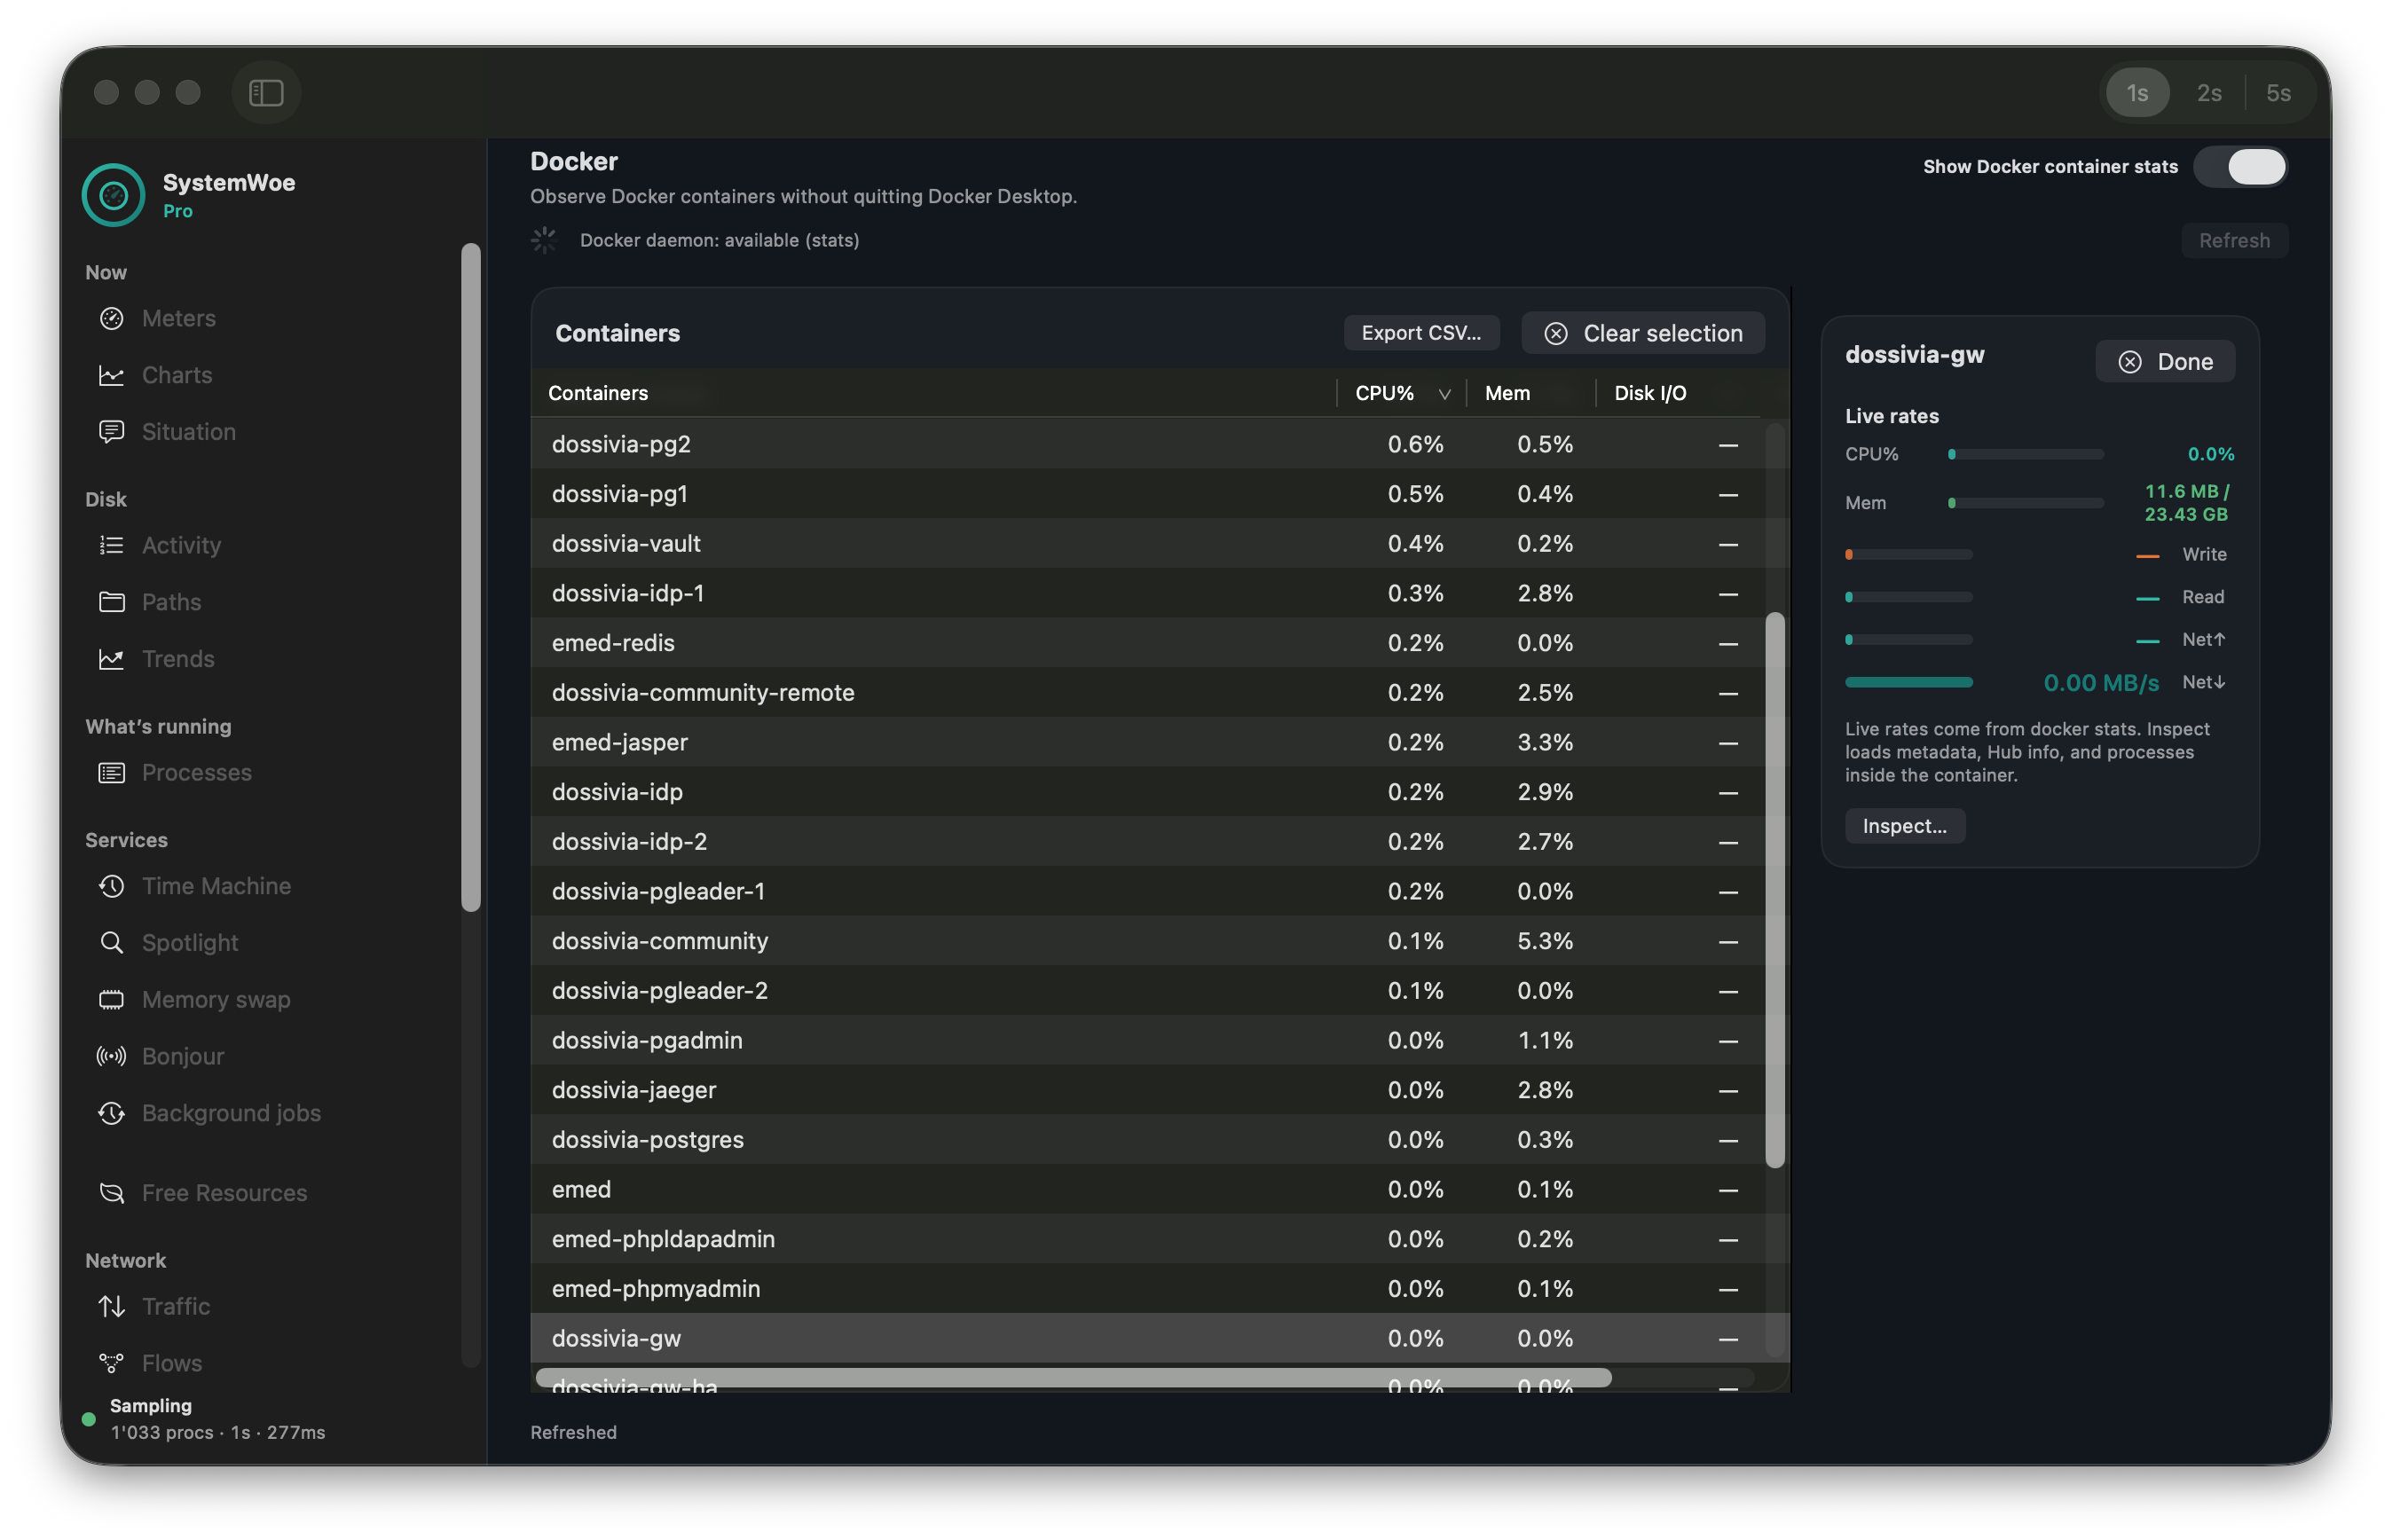
Docker without quitting Desktop
Observe container CPU, memory, and disk I/O when Docker is the reason you’re out of RAM.
- Metrics and Containers outline; stats on your schedule
- Inspect / top / Hub on demand — inventory stays observe-first
- Keep-guards refuse destructive actions against protected stacks
Pro
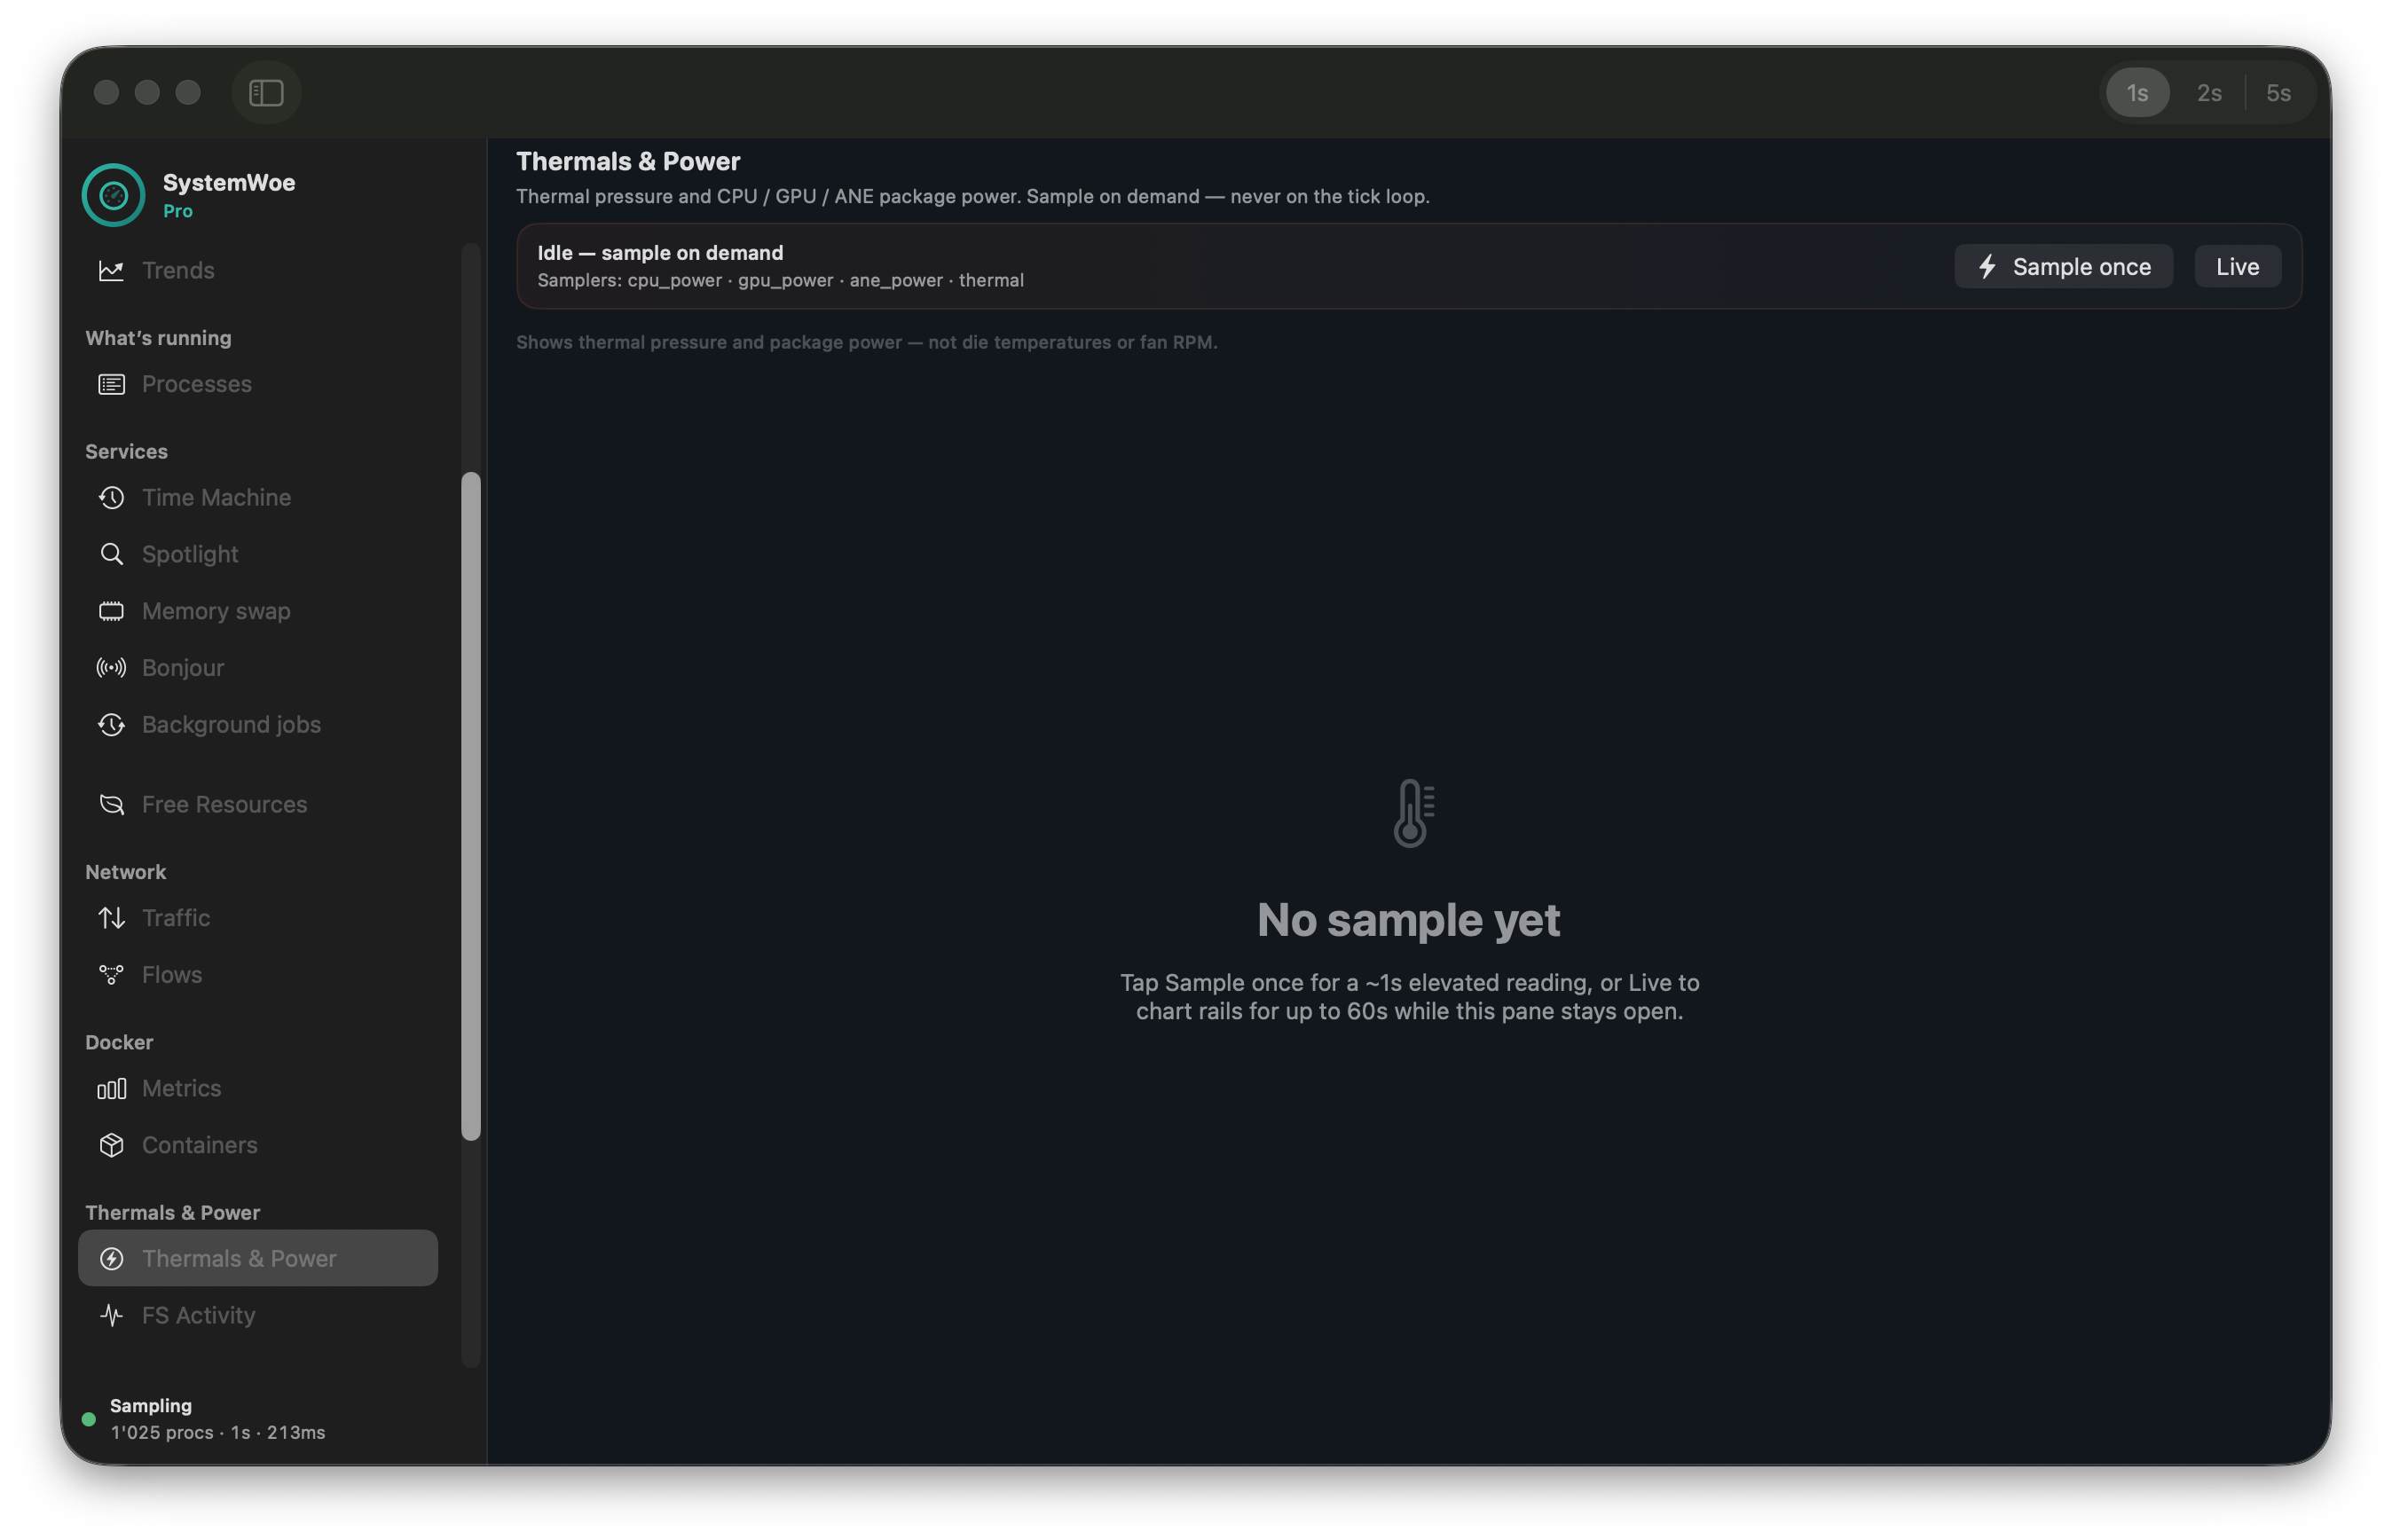
Thermals & Power — on demand
When the Mac feels hot: CPU, GPU, and ANE milliwatts plus thermal pressure — never on the sample tick.
- Sample once or Live ≤60s while the Power pane is open
- Shows up in Samplers Activity as a session worker
- Overview can surface a thermal chip from the last elevated sample
Pro
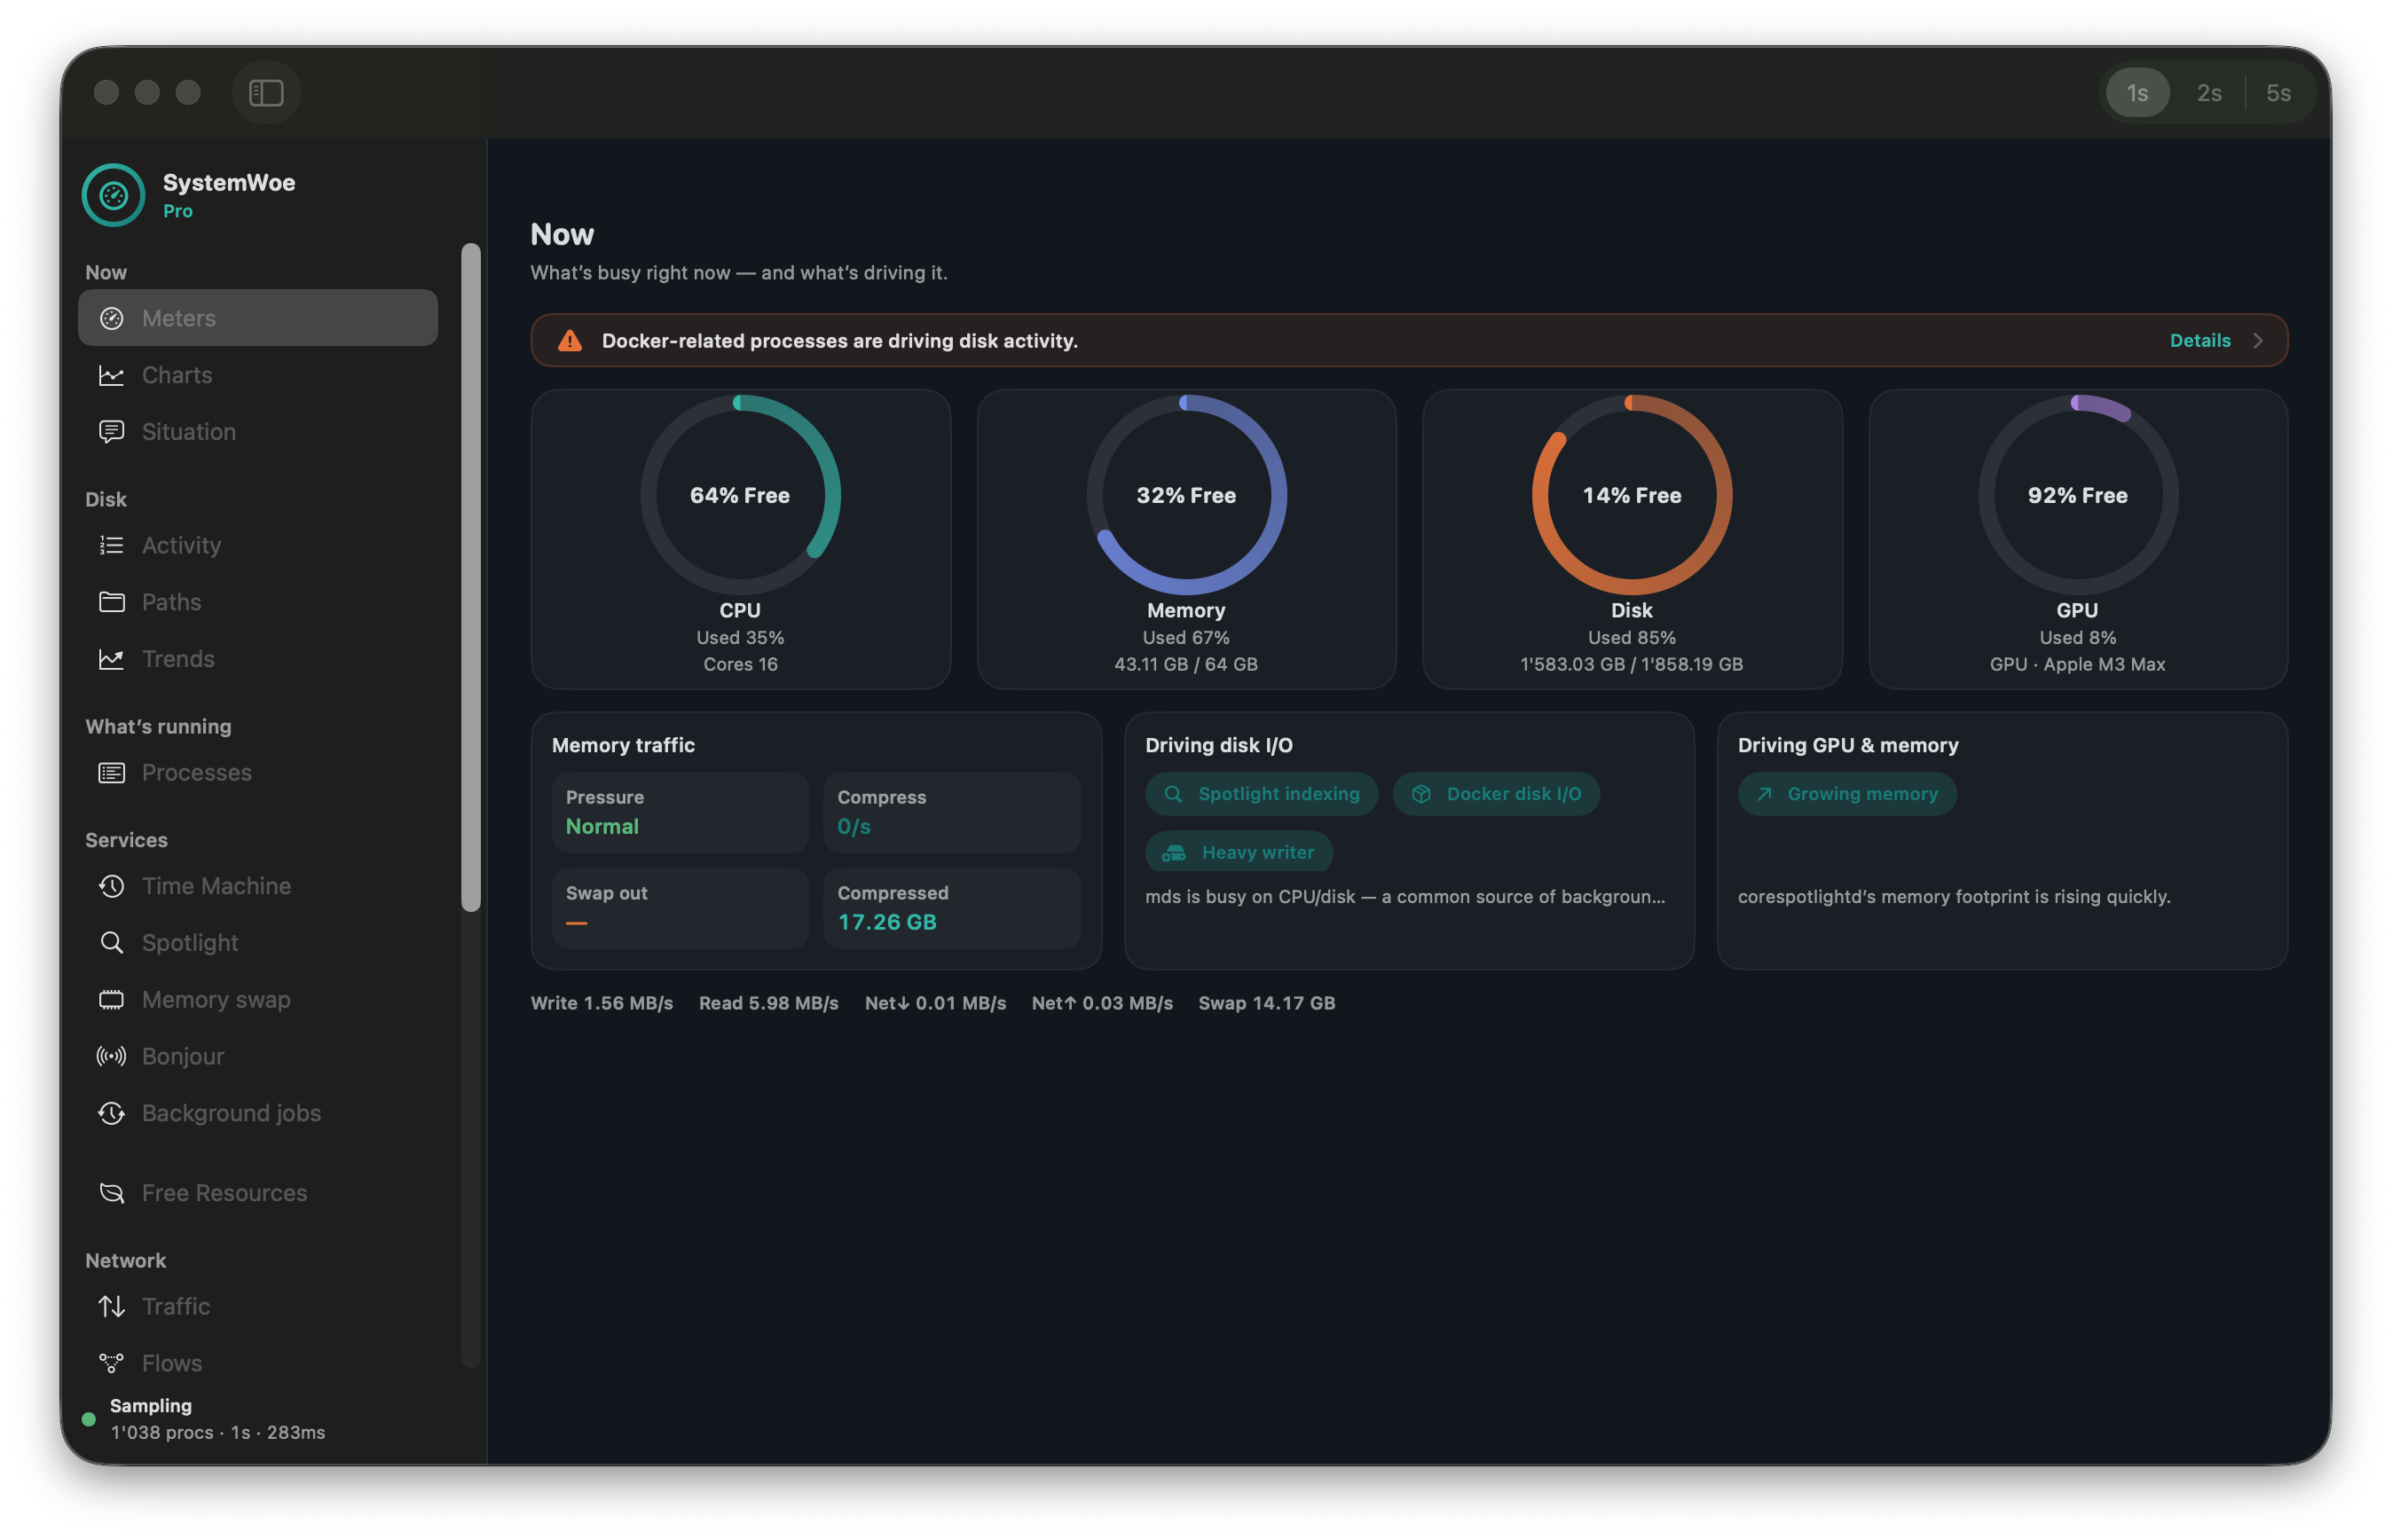
Local history you control
Trends, top apps, Backup & Spotlight flags, and Power trail — on your Mac, under a disk budget.
- Path boards only from Sample / Watch sessions you started
- Export CSV or clear anytime; pause collection in Settings
- No cloud metrics sink — History stays local